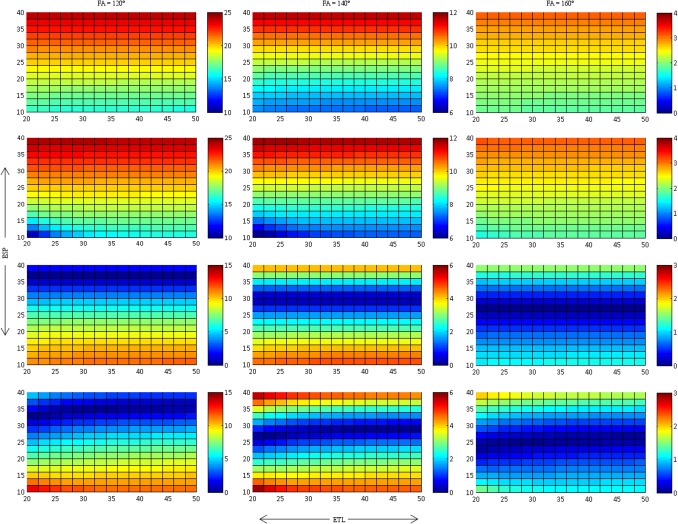
Fig 4. Relative S0 deviation, dS0 (in %), for methods 1–4 corresponding to rows 1–4 respectively.
Closer approximations with little difference are seen for both equations with the first point excluded from the fit. Please note that the scales of dS0 are not uniform and therefore provide maximum dynamic range for the different ETL and ESP.

