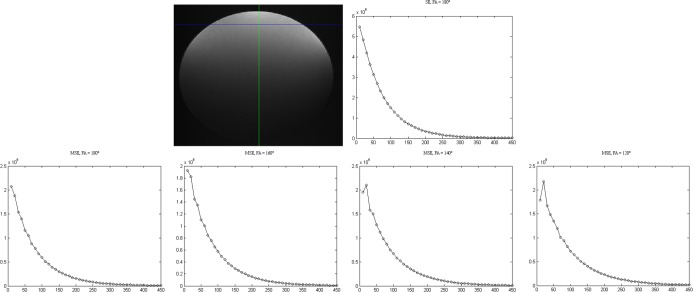
Fig 6. Example of the signal decay curves of the phantom measurements for a defined pixel (shown by the cross section of the lines): Curves are shown for the single spin echo sequence (top right) and the MSE sequences for different FAs (bottom row).
The X-axis represents TE and y-axis the signal (x 106 a.u). It can be noticed that as the FA reduces the first point, in particular, deviates from the expected exponential decay curve. The variation of the refocusing FA was performed by variation of the FA in the sequence protocol. The actual FA at the respective position might even differ from this value due to B1 inhomogeneities and imperfect slice profiles.

