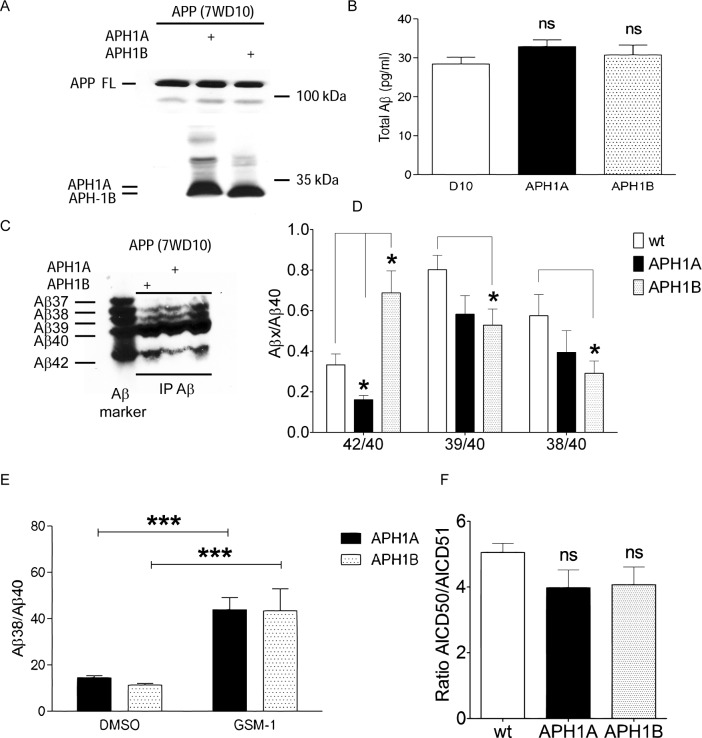
Fig 8. Effects of APH1A and APH1B on APP processing.
(A) Comparable expression of APH1A or APH1B in CHO cells overexpressing wild type APP (7WD10) cells after stable transfection as detected by anti-HA antibody. (B) Expression of APH1A or APH1B had no effect on total Aβ levels as assessed by ELISA. (C) Representative western blot analysis of Aβ peptides from APH1A or APH1B expressing cells showing altered profile of Aβ peptides. (D) Quantification of Aβ levels of CHO cells expressing APH1A or APH1B shown in (C). Note the significant alterations in the ratios of Aβ42/40 as well as shorter Aβ species. However, Aβ42/40 ratios were altered in opposite directions following APH1A as compared to APH1B expression (n = 3; * p < 0.05, Repeated Measures ANOVA Tukey's Multiple Comparison Test; averages ± S.E.). (E) GSM-1 increased Aβ38 levels in CHO cells overexpressing either APH1A or APH1B (n = 3; *** p<0.001, Repeated Measures ANOVA Tukey's Multiple Comparison Test; averages ± S.E.). (F) No changes were seen in the ratio of AICD50/51 peptides quantified from crude membranes of CHO cells overexpressing either APH1A or APH1B and (n = 3, averages ± S.E.).

