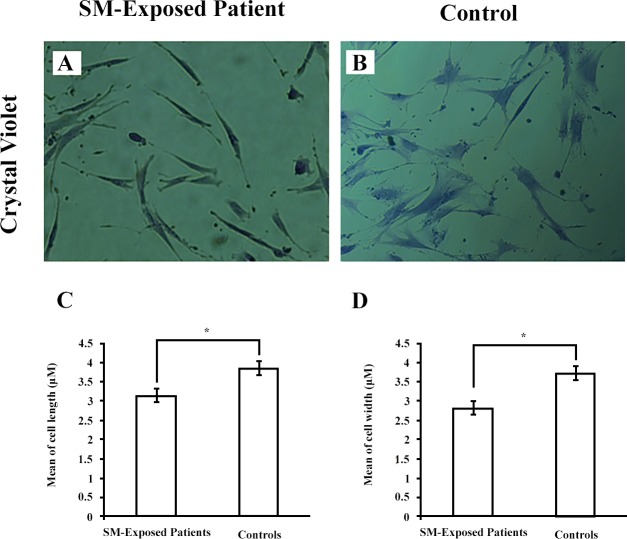
Fig 3. Morphologic characterization of fibroblast.
Fibroblasts from both SM-exposed patients and controls (A and B; 40×) were stained with Crystal Violet. Twenty cells/sample were measured for each patient. The results are presented for both length (C) and width (D) as mean ± SEM for patients (n = 5) and controls (n = 4). *p < 0.05. Abbreviations: SM sulfur mustard.

