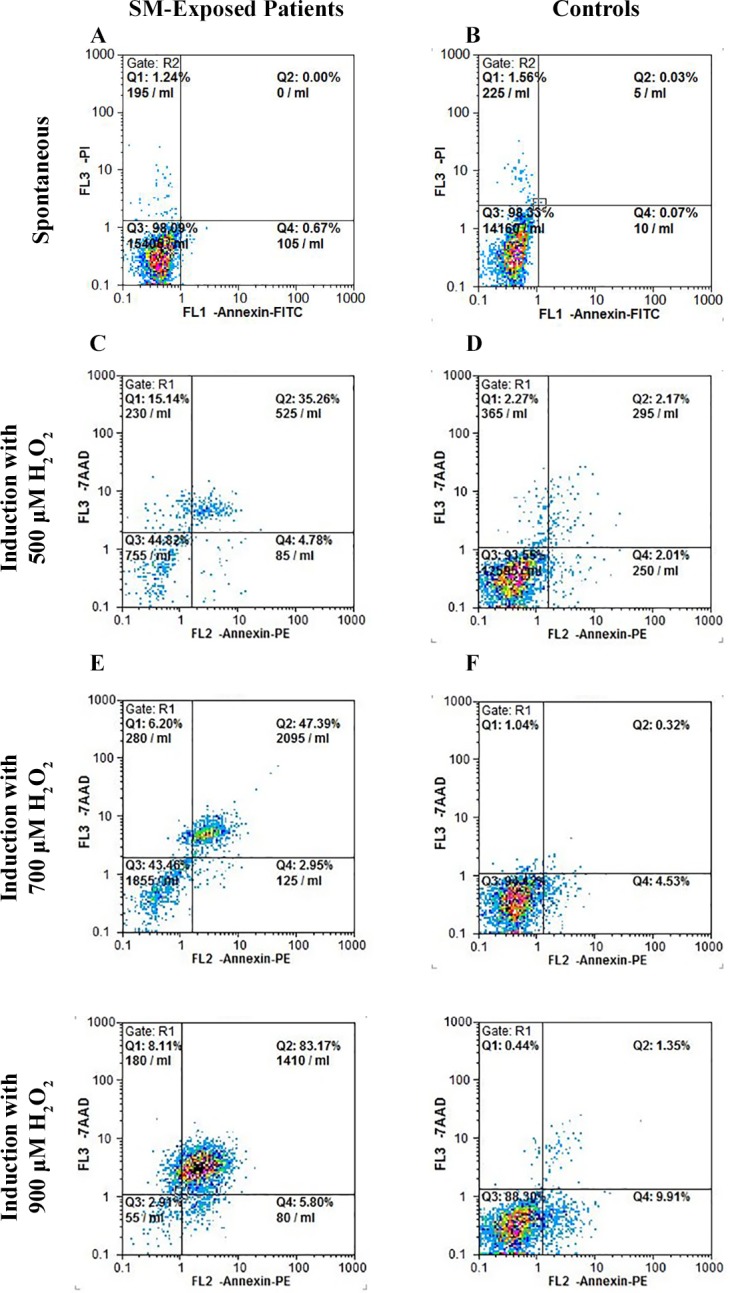
Fig 7. Flow cytometric analysis for apoptosis of fibroblasts.

Representative dot plots of the flow cytometric analysis of the Annexin V–FITC/propidium iodide (PI) following induction of apoptosis with H2O2. Fibroblasts derived from SM-exposed patients and controls were assessed for spontaneous apoptosis and apoptosis following treatment with 500, 700 and 900 μM of H2O2. Spontaneous apoptosis was not significantly different in SM-exposed patients and controls. However, a higher dose-dependent sensitivity to H2O2 is observed in patients as compared with controls. Q1: necrotic cells, Q2: late apoptotic cells, Q3: viable cells, and Q4: early apoptotic cells.
