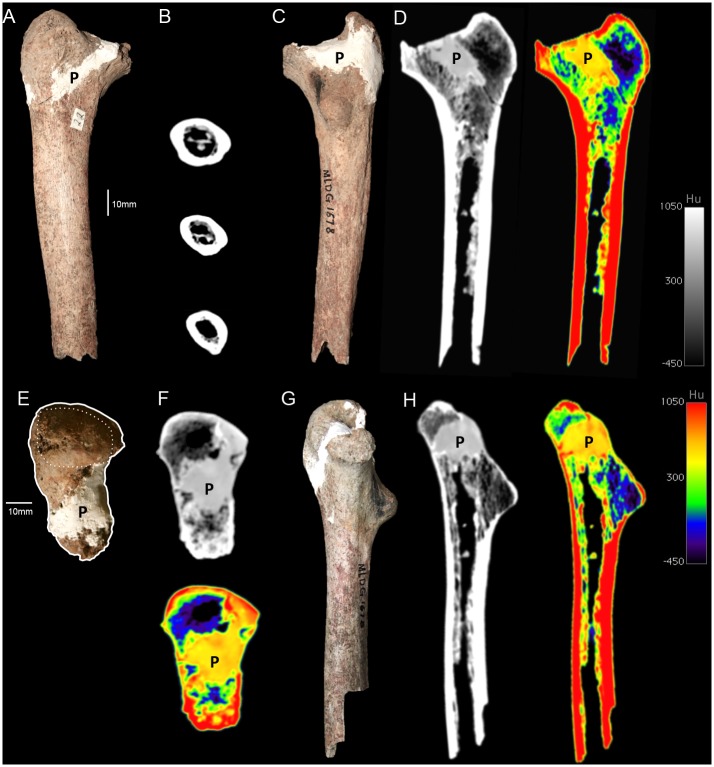
Fig 1.
Femur MLDG 1678: (A) Anterior view. (B) CT-scan slices at subtrochanteric, approximate half-way and mid-shaft levels. (C) Posterior view. (D) CT-scan slice at approximately mid-coronal plane, grayscale (left) and colour density map (right). (E) Superior view highlighting the overall outline and superior surface of the greater trochanter (anterior at left, lateral at top). (F) CT-scan transverse slices at approximate mid-neck level, grayscale (left) and colour density map (right). (G) Medial view. (H) CT-scan slices in approximate mid-plane, grayscale (left) and colour density map (right). (P = plaster added in 1989 during restoration).

