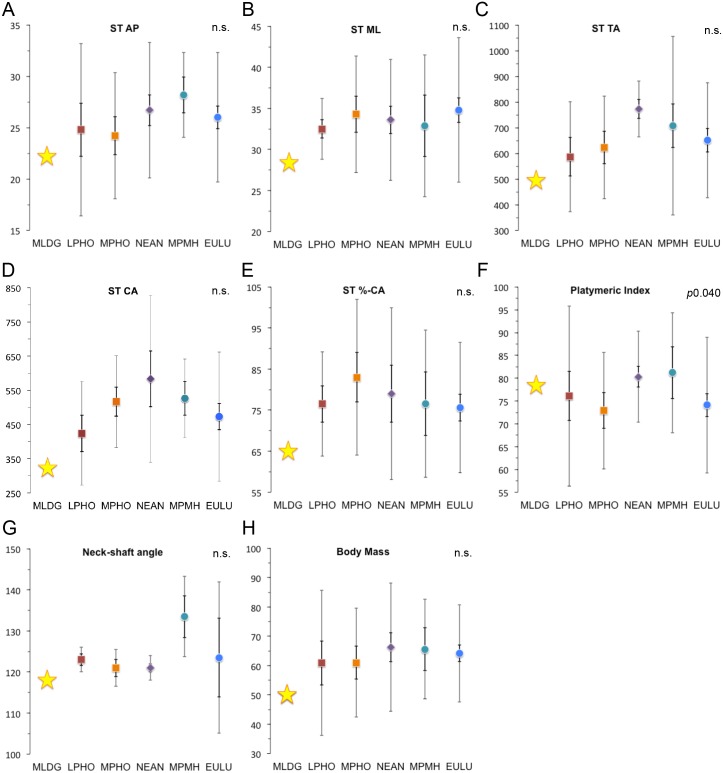
Fig 2.
Scatterplots comparing sample medians for subtrochanteric (ST) variables, neck-shaft angle and reconstructed body mass: (A) Anteroposterior (AP) diameter (mm). (B) Mediolateral (ML) diameter (mm). (C) Total area (TA: mm2). (D) Cortical area (CA: mm2). (E) %-Cortical area (%-CA). (F) Platymeric index (%). (G) Neck-shaft angle (°). (H) Reconstructed body mass (kg). (Error bars = 95% confidence interval of median [dark] and 1.5 x interquartile range [light]; Abbreviations: LPHO = Lower Pleistocene Homo; MPHO = Middle Pleistocene Homo; NEAN = Neanderthals; MPMH = Middle Pleistocene Modern Humans; EULU = Early Upper-Late Upper Palaeolithic humans [see S1 Table]).

