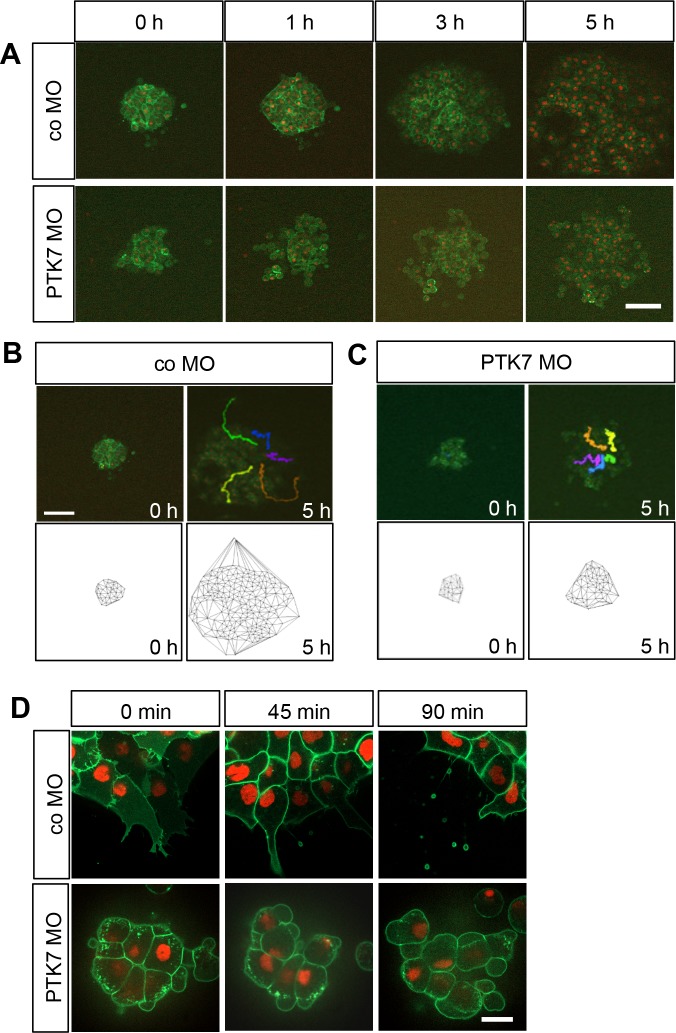
Fig 3. Loss of function of PTK7 affects NC cell shape and inhibits migration of explanted NC.
A Time series showing explanted NC cells injected with 7.5 ng control or PTK7 MO in combination with 50 pg mGFP RNA and 250 pg H2B-mcherry. Cranial NC explants were excised at stage 16–17 and explanted on a fibronectin matrix and incubated until they had stably adhered to the matrix. NC migration was monitored for 5 hours using spinning disk microscopy (10x objective NA 0.45). Images for representative explants injected either with control or PTK7 MO are shown at the start of the experiment (0 h) or after 1, 3 or 5 hours; scale bar = 50 μm. B Cell tracking and Delaunay triangulation for explants injected with 7.5 ng co MO. The upper panel shows a single frame of the spinning disk movie and the lower panel the Delaunay triangulation at the start of the experiment (0 h) or after 5 hours. Cells were tracked over the whole five-hour time interval using the H2B staining of single nuclei. These tracks are shown for single cells as differently colored lines in the images taken after 5 hours, scale bar = 50 μm. C Cell tracking and Delaunay triangulation for explants injected with 7.5 ng PTK7 MO. D Time series showing explants injected with 7.5 ng co MO (upper panel) or 7.5 ng PTK7 MO (lower panel) at a higher magnification. Injected NC cells were explanted at stage 17, cultured for 1.5 hours and imaged with a 63x objective (NA 1.4); scale bar = 20 μm. Images are shown at the start of the experiment (0 min) and after 45 and 90 minutes.

