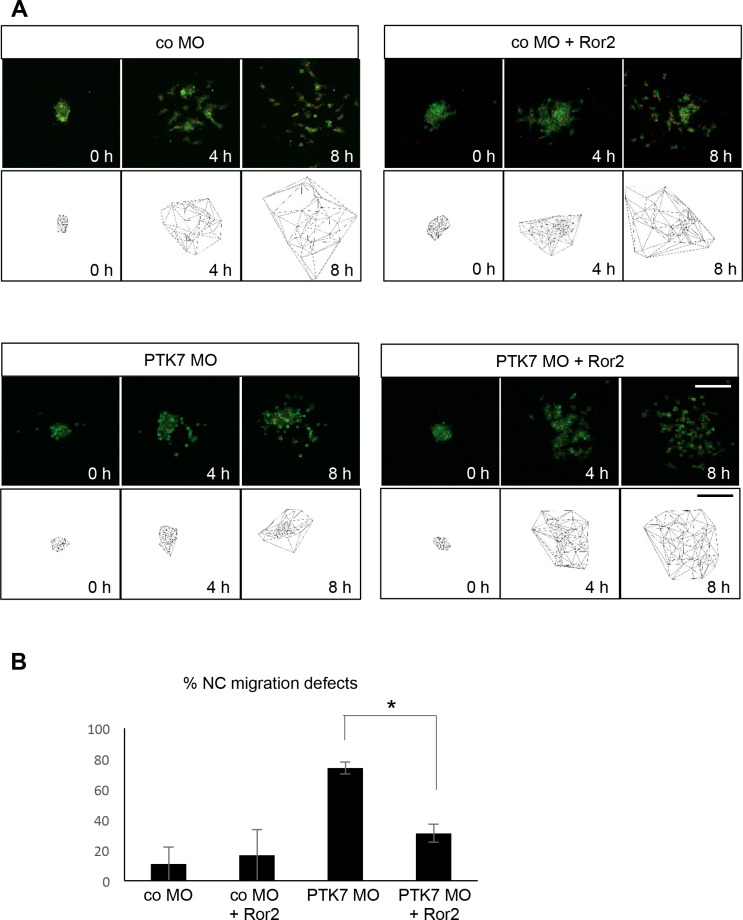
Fig 4. Ror2 rescues the PTK7 loss of function phenotype in explanted NC cells.
A NC explants injected with 7.5 ng MO in combination with 50 pg mGFP RNA, 250 pg H2B-mcherry and 150 pg Ror2 RNA. Time-lapse images (upper panel) and Delaunay triangulations (lower panel) at the start of the experiment (0 h) and after 4 or 8 hours are shown for the different conditions. B Graph summarizing percentage of migration defects of 3 independent experiments (total of 39 explants). Standard error of the means are shown. Asterisks indicates a p-value in a Student’s t-test < 0.05. Scale bars = 200 μm.

