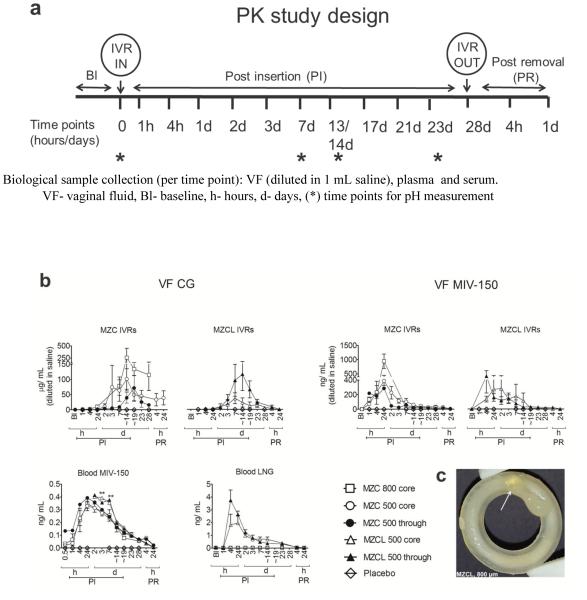
Figure 3. PK profiles of APIs from MZC/ MZCL IVRs with varying pore configurations in non-DP treated macaques.
(a) Schematic representation of PK study timeline for IVR insertion and removal, pH measurement and sample collection at indicated timepoints (b) CG and MIV-150 levels (upper row) in VF from MZC IVRs of 500 μm pore (core side, n=10), 500 μm pore (through, n=11), 800 μm pore (core side, n= 4) and MZCL IVRs of 500 μm pore (core side, n=3) and 500 μm pore (through, n=3). MIV-150 and LNG levels (bottom left) in blood from the same rings. Data represents mean ± SEM. ** p < 0.01 (MZC vs. MZCL) (c) Image of an MZCL IVR with 800 μm pore IVR removed post 21 days in vivo insertion (as collected from the lumen with no further post-treatment). The ZA/CG from the core released as a gel (arrow) demonstrating proof-of-concept. The IVR dimensions are same as that in Figure 1A.

