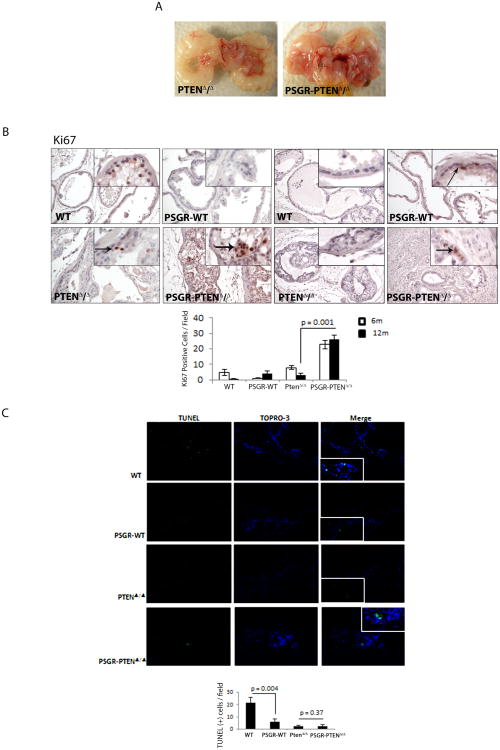
Figure 2. PSGR overexpression induces proliferation in a Pten deleted background.
A Representative macroscopic image of male genitourinary tract showing differences between 12 month old Pten deleted mice (PTENΔ/Δ) and Pten deleted mice overexpressing PSGR (PSGR-PTENΔ/Δ) B. Ki67 staining showing increased proliferation in PSGR overexpressing Pten-deleted mice, both at 6 months (left) and 12 months (right). Bar graph represents average Ki67 positive cells/field, ± standard error (n=4 per genotype per age). p = 0.001, t-test. Arrows indicate location of positive staining cells. C. TUNEL assay showing differences in cell apoptosis between different genotypes. Bar graph represents average TUNEL positive cells/field, ± standard error (minimum 10 fields analyzed per section; n=4 per genotype) p = 0.004 and p = 0.37, t-test.

