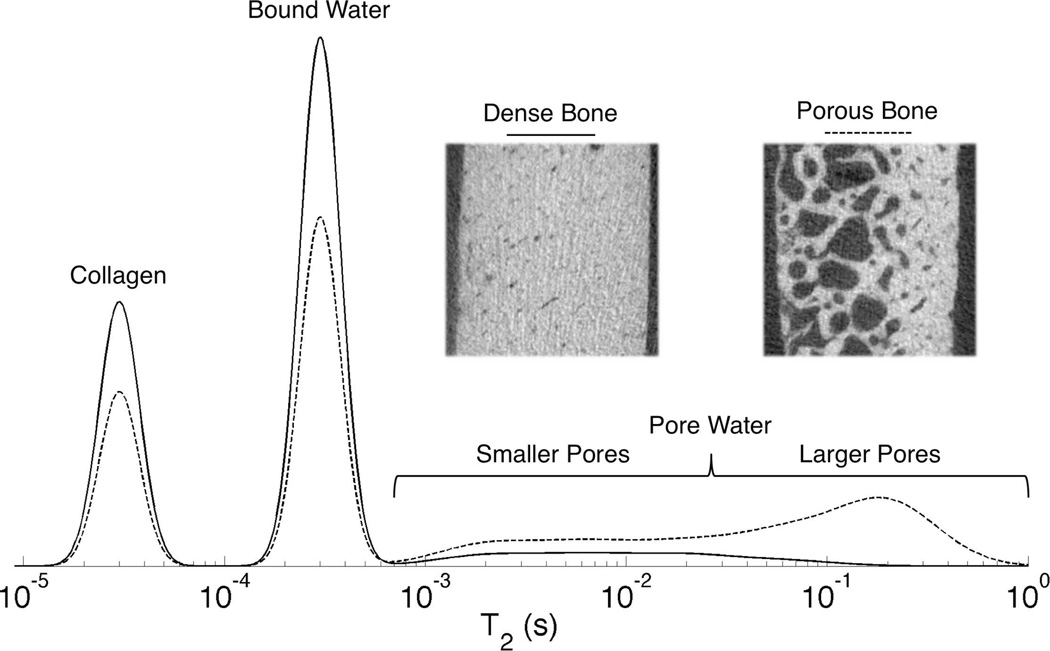
Figure 1.
Schematic T2 relaxation spectrum diagramming the three major 1H NMR signal pools in bone. Pore water has T2 > 1 ms and is broadly distributed, while bound water has T2 ~ 300–500 µs. Collagen and macromolecular signal, at T2 ~ 40–60 µs, is below the detection limit at clinical field strengths, but becomes visible using micro-imaging and spectroscopic hardware. As porosity increases, as shown in the inset µCT images of bone specimens from 27 y/o and 83 y/o female donors (dense and porous bone, respectively) collagen and bound water content decrease while pore water content increases and shifts to longer T2 values due the smaller surface-to-volume ratio of enlarged pores.

