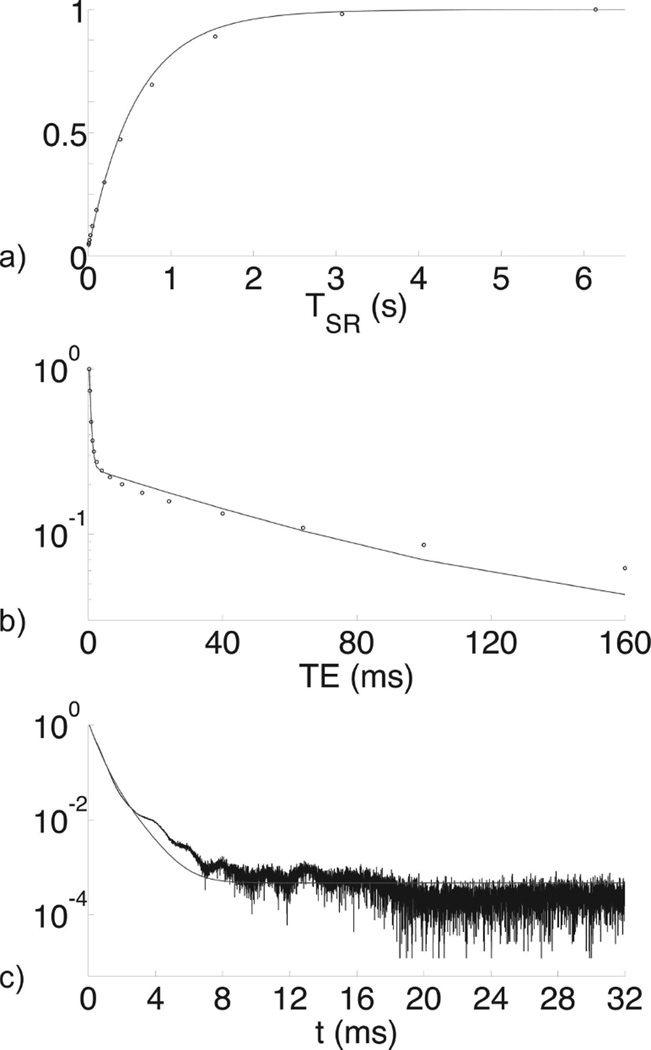
Figure 3.
NMR data (points) from a bone specimen from a 53-year-old male with bi-component fits (curves). Panel (a) shows a T1 fit of saturation-recovery data, (b) shows a T2 fit of CPMG echo amplitudes, and (c) shows a T2* fit of a FID. Although only one-dimensional data are shown, fits were performed using the two-dimensional methods given in the methods section (a,b: T1–T2; c: T2-T2*). Vertical axes are normalized to M0.

