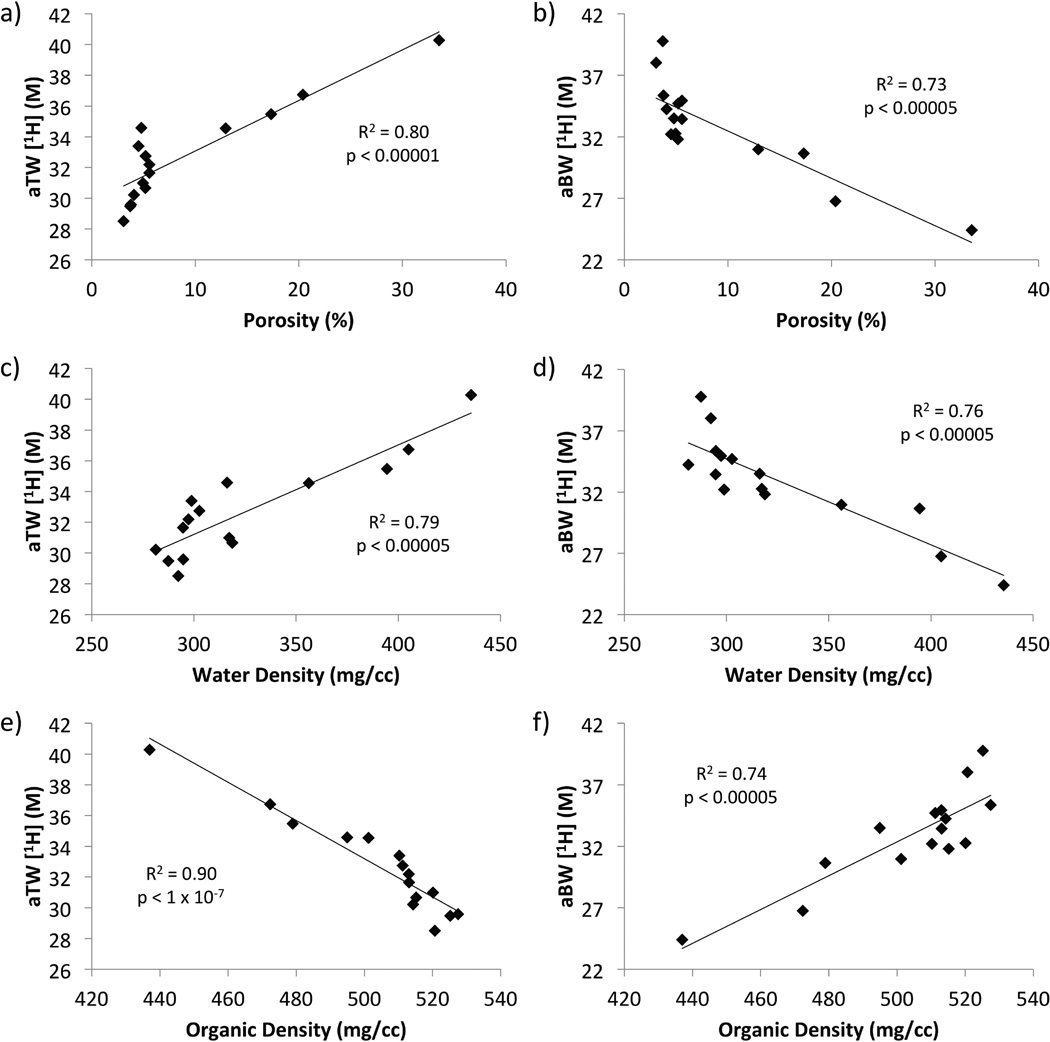
Figure 7.
Scatter plots displaying the correlations of apparent total water (aTW, a,c,e) and apparent bound water (aBW, b,d,f) 1H concentrations versus µCT porosity (a,b), gravimetric water density (c,d), and gravimetric organic matrix density (e,f). Apparent total water 1H concentration is positively correlated with porosity and gravimetric water density and negatively with matrix density, while aBW correlations show the opposite behavior.

