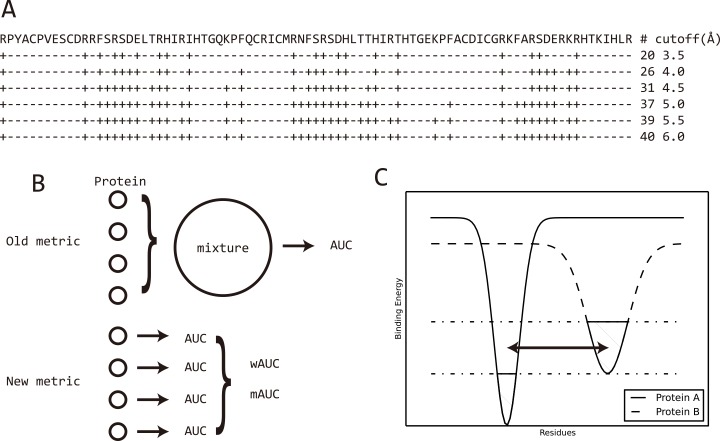
Fig 1. Binding site definition and assessment metrics can result in accuracy variation.
A) Binding site definition of Zif268 protein based on different distance cutoffs. ‘+’ marks the binding sites while ‘-’ marks non-binding sites. With a distance cutoff of 6.0Å, 40 residues are defined as binding sites, which is twice that obtained with a cutoff of 3.5Å; B) Two metrics to measure prediction accuracy in terms of AUC. Old metric mix all the residues from all the proteins together for comparison, then measure AUC on the mixed data. Metric in this work measures AUC for each protein and average the AUC values considering protein length. C) A scheme to illustrate the irrelevant comparison between binding sites of a protein and the non-binding sites on another protein. As protein A and protein B may have different size of nucleic acid binding region and binding affinity they are possible to have different energy funnels. The dashed region shows the binding region of the two proteins. Binary assessment, which mixes all residues together, will certainly include comparison between non-binding sites of protein A and binding sites of protein B, shown by the double arrowed line.

