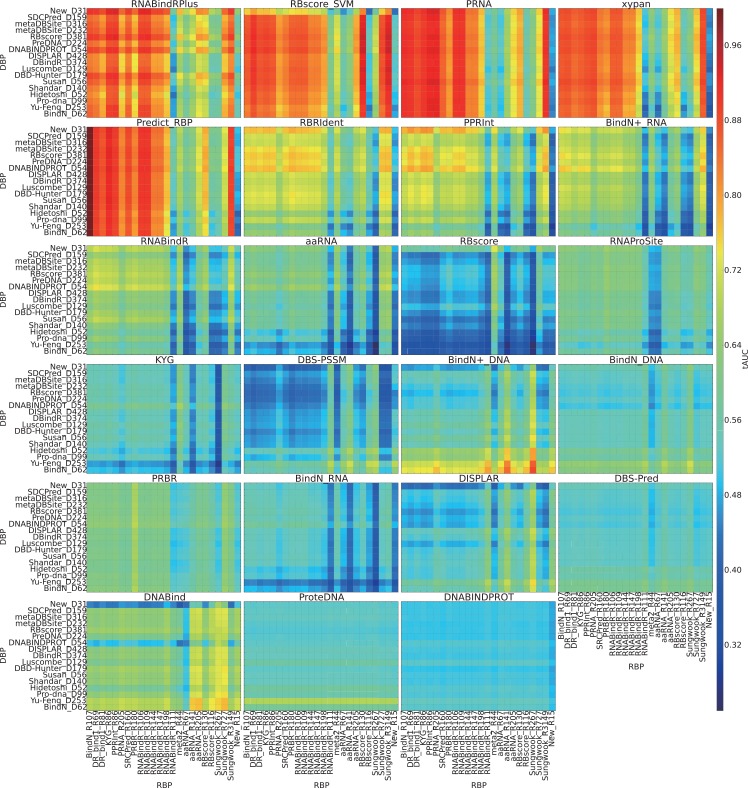
Fig 4. Discrimination between RNA binding sites and DNA binding sites.
For DNA binding site prediction programs, DNA binding sites (3.5Å as distance cutoff) from a data set are taken as positive while RNA binding sites from another data set are taken as negative, the AUC values of these discriminations are plotted with different colors. RNA binding site prediction programs take the opposite. Each grid on the heat map show the assessment result in terms of AUC on such a DNA binding sites vs. RNA binding sites data set. i.e. The grid BindN_R107(x-axis)-Susan_D56(y-axis) of program PRNA is to use all the RNA binding sites of BindN_R107 data set as positive while using all DNA binding sites of Susan_D56 data set as negative and measure the AUC value of program PRNA.

