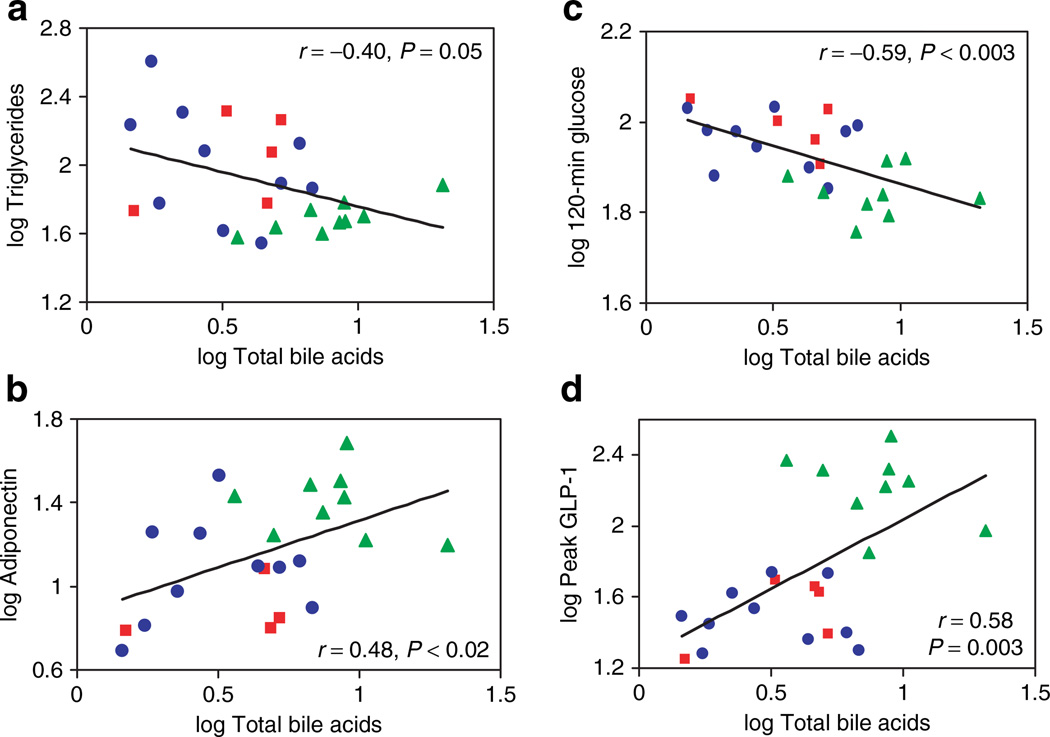
Figure 2.
Linear regression relationships between serum bile acid levels and (a) fasting triglycerides, (b) plasma adiponectin, (c) glucose level at 2-h post-mixed meal, and (d) peak GLP-1 level post-mixed meal in all subject groups. Morbid obesity (MOb) subjects are designated by the red squares, overweight (Ov) by blue circles, and post-GB (GB) by the green triangles.

