Figure 4.

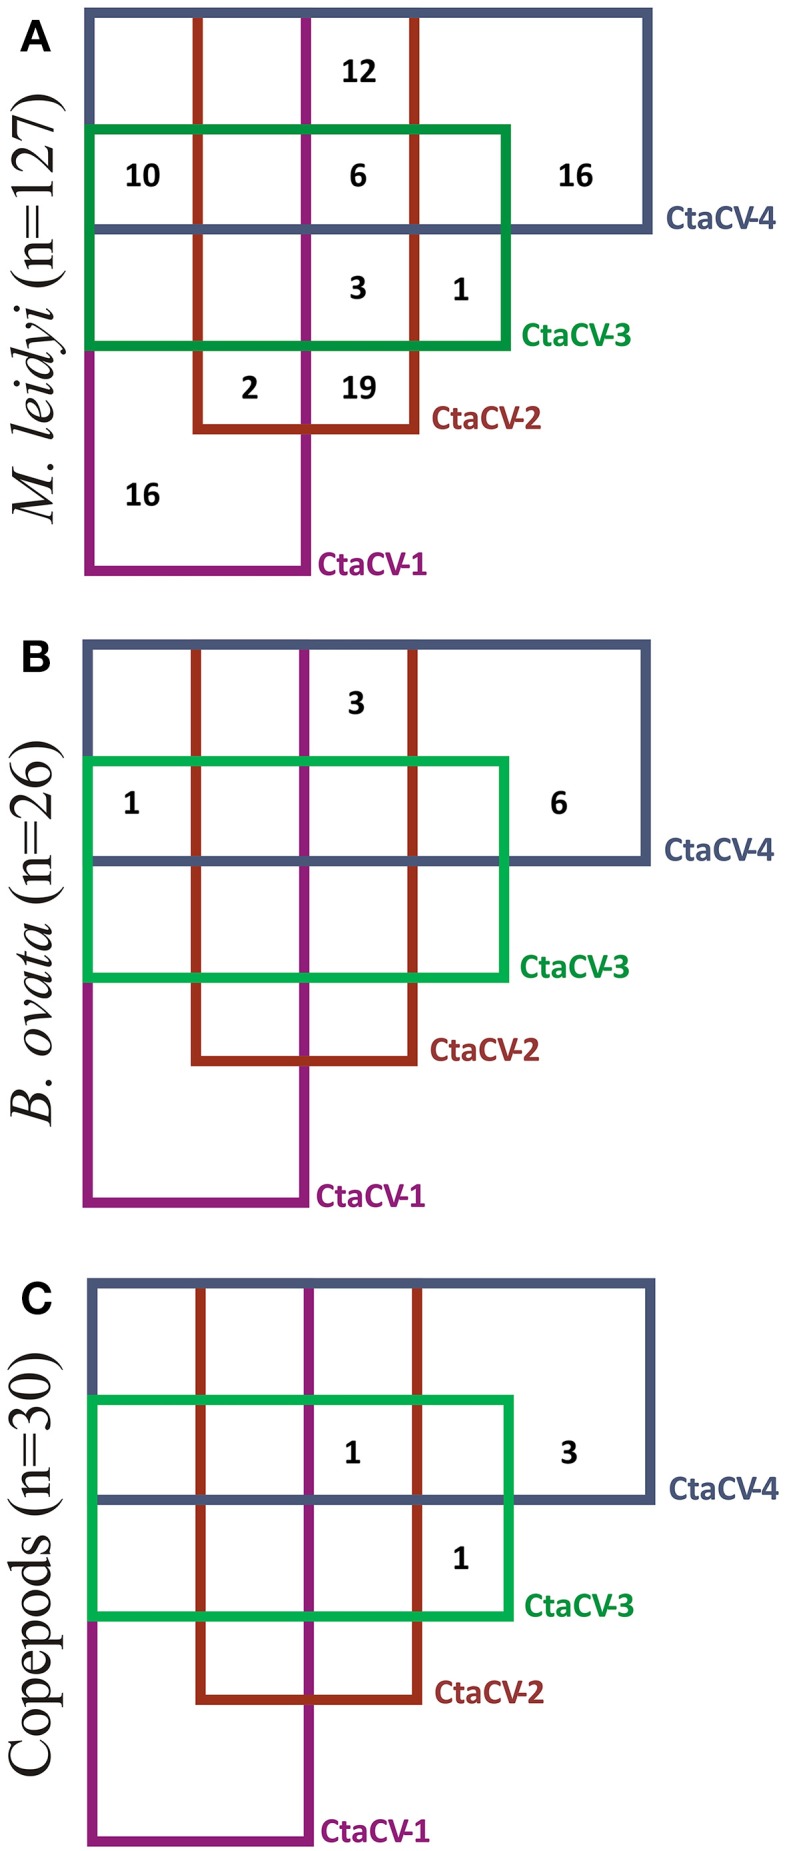
Venn diagram showing the prevalence of each of the ctenophore-associated circular virus (CtaCV) genomes alone or in combination with other CtaCV genomes in (A) M. leidyi, (B) B. ovata, (C) pools of copepods.

Venn diagram showing the prevalence of each of the ctenophore-associated circular virus (CtaCV) genomes alone or in combination with other CtaCV genomes in (A) M. leidyi, (B) B. ovata, (C) pools of copepods.