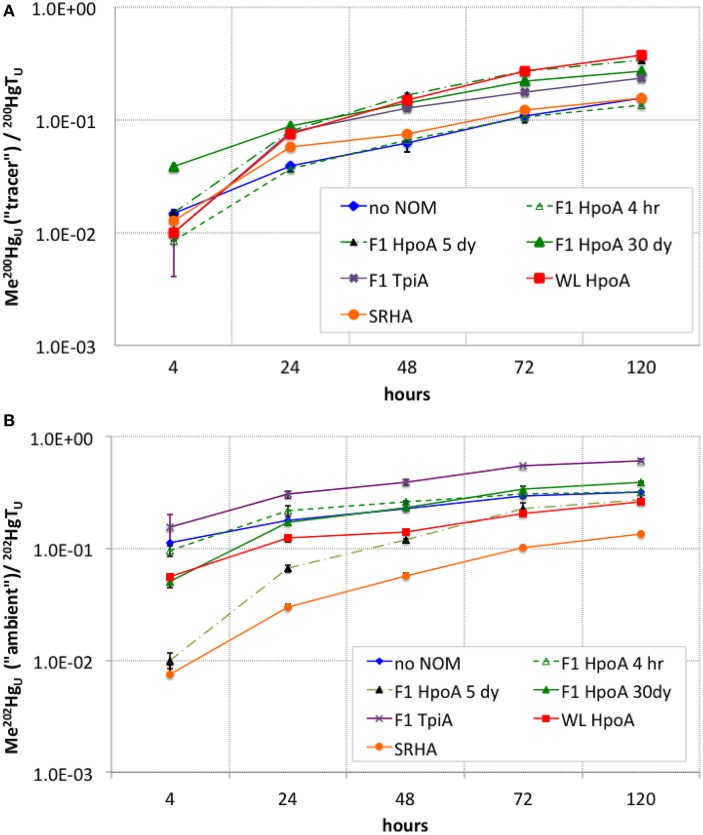
Figure 3.
(A) Cumulative conversion of 200Hg(II) tracer to Me200Hg, normalized to total unfiltered 200Hg, for each NOM isolate culturing condition. (B) Cumulative conversion of ambient 202Hg(II) to Me202Hg, normalized to total unfiltered 202Hg, for each NOM isolate culturing condition. The subscript “U” indicates the measurements represent unfiltered MeHg concentrations at each sampling timepoint. Error bars represent one standard error on the mean of 2–3 replicates.

