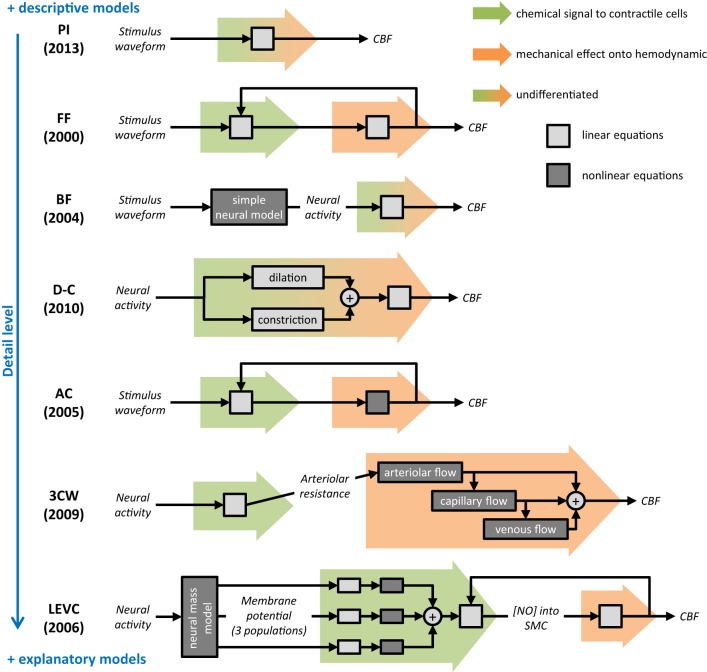
Figure 3.
Summary and comparison of selected dynamic models of neurovascular coupling. As for the rest of this review, only the neurovascular coupling compartment is considered. For each model, a schematic represents the mathematical process proposed to calculate the output cerebral blood flow (CBF) from the input (stimulus waveform or neural activity). Background colored arrows refer to the two steps of NVC described in Figure 2: chemical signal from neurons/glia to contractile cells (green) and mechanical effect onto hemodynamic (orange). Boxes indicate either underlying equations are linear (light gray) or not (dark gray), and report the overall mathematical complexity. On the right, blue scale orders models regarding their detail level. Selected model names: PI, proximal integration; FF, Friston flow; BF, Buxton flow; D-C, dilation-constriction; AC, arteriolar compliance; 3CW, 3 compartments Windkessel; LEVC, local electro-vascular coupling.

