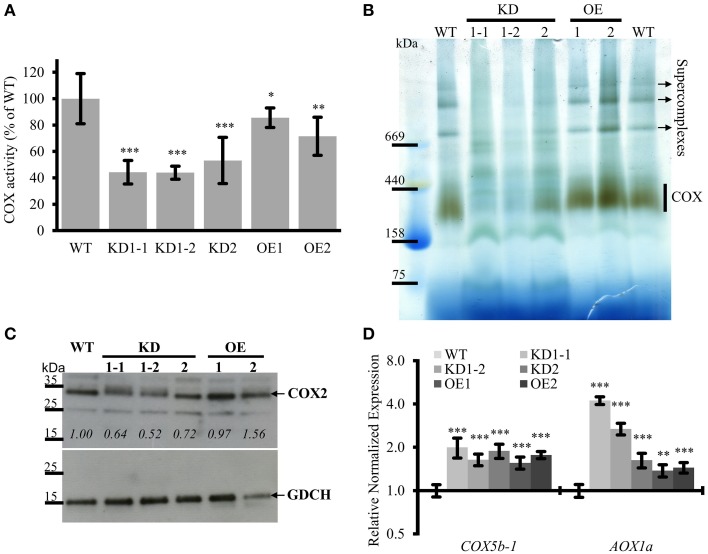
Figure 6.
COX complex activities are reduced in COX11 KD and OE mutants. (A) COX activities in KD and OE mutants and the WT were measured in three independent mitochondria isolations (each in technical triplicate) and normalized to the WT (= 100%). Asterisks indicate statistical significance calculated with the Student's t-test (*P < 0.05; **P < 0.01; ***P < 0.001). Error bars represent ± SD. (B) Mitochondrial complexes from COX11 KD, OE and WT plants were separated by gradient BN-PAGE and subsequently stained in gel for COX complex activity visible as a brown precipitate. For WT, 100 μg of crude mitochondria was loaded, while for the mutants amounts were adjusted (based on citrate synthase activity) to compensate for contaminations. (C) Total leaf proteins from WT, KD, and OE plants (6 weeks old) were analyzed by Western blotting, using antibodies against COX2 (theoretical molecular weight of 30 kDa). The membrane was stripped and subsequently incubated with antibodies against GDCH (theoretical molecular weight of 16 kDa) as a loading control. In this experiment T4-generation KD1-1 plants were used (Supplementary Figure 2B). Values in italics indicate estimated COX2 abundance after densitometry analysis and normalization to GDCH amounts. (D) qPCR analysis of indicated transcript levels in WT and COX11 mutants. RNA was isolated from 14-day-old seedlings cultured on selective (KD mutants) or non-selective MS (WT) plates. Mean values of mRNA levels in COX11 mutants were normalized to WT and plotted on a logarithmic scale (base two). Values and statistical significance (compared with the WT, **P < 0.01, ***P < 0.001) were calculated with the CFX manager software. Error bars represent ± SD. All individual values are listed in Supplementary Table 5.

