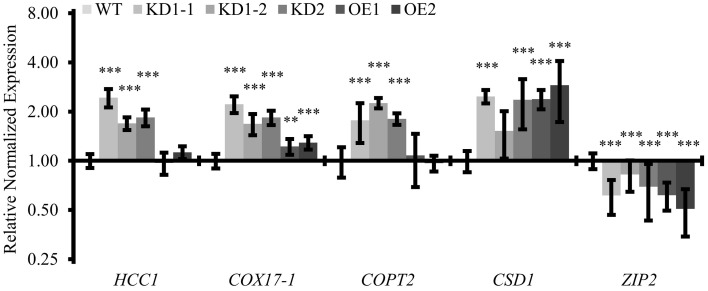
Figure 9.
Quantitative analysis of transcripts associated with copper metabolism. qPCR analysis of indicated transcripts in WT and COX11 mutants. RNA was isolated from 14-day-old seedlings cultured on selective (KD) or non-selective MS (WT, OE) plates. Mean values of mRNA levels in COX11 mutants were normalized to WT and plotted on a logarithmic scale (base two). Values and statistical significance (compared with the WT, **P < 0.01; ***P < 0.001) were calculated with the CFX manager software. Error bars represent ± SD. Individual values are listed in the Supplementary Table 5.

