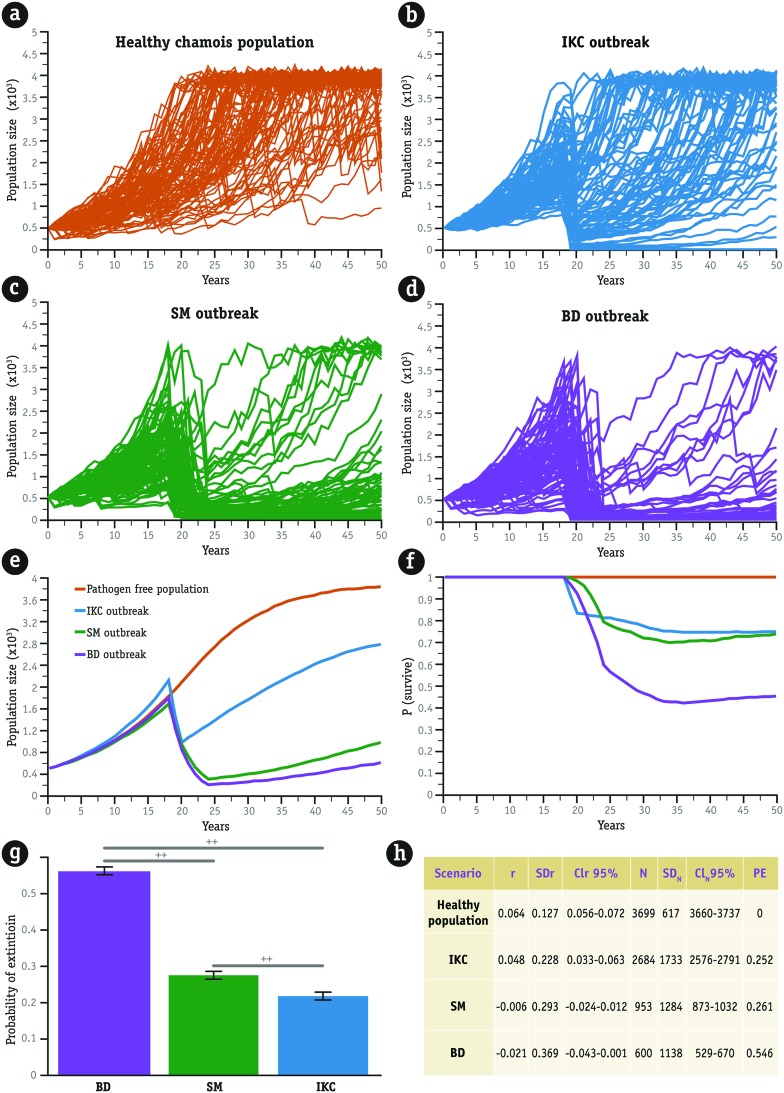
FIGURE 1.
Stochastic simulations of the extinction process in a fictitious population of 500 chamois for 50 years. The hypothetical scenario has a carrying capacity of 4000 individuals and suffered the demographic consequences of five heavy winters. (a) A pathogen-free population of chamois only driven by density dependence and climate severity. (b) The consequences of a severe 2-year outbreak of infectious keratoconjunctivitis (IKC) in year 20. (c,d) The simulation of 5-year sarcoptic mange (SM) and border disease (BD) outbreaks, respectively, are shown, also in year 20. The number of populations that went extinct, represented by lines perpendicular to the X axis in (b–d) is greater for the population affected by BDV than for the other two (summarized in e). In any case, extinction was reached when the population number was reduced to 30 individuals. We performed 1000 simulations in each case, but (a–d) plots show only the output of the first 100 simulations. Along the same line, (f) shows the lower probability of survival after a disease outbreak. Information presented in plots (e) and (f) is based on 1000 simulations. The bar plot in (g) summarizes the results of ANOVA aimed at testing differences between probabilities of extinction over 50 years caused by the three diseases. These probabilities were calculated for 60 simulations (20 for each pathogen), with outbreaks occurring at different population sizes (from 600 to 1550, 50 simulations for each case). Whiskers represent the standard deviation and the horizontal lines the results of a post hoc Tukey’s HSD test. Statistically significant differences, at α = 0.05, are indicated by crosses. Statistical summary is shown in table (h). Mean stochastic growth rate of the population (r), Mean final population size (N), associated standard deviations (SDr, SDN) and confidence intervals at 95% (CIr, CIN), and mean probability of extinction (PE) after our 1000 simulations.

