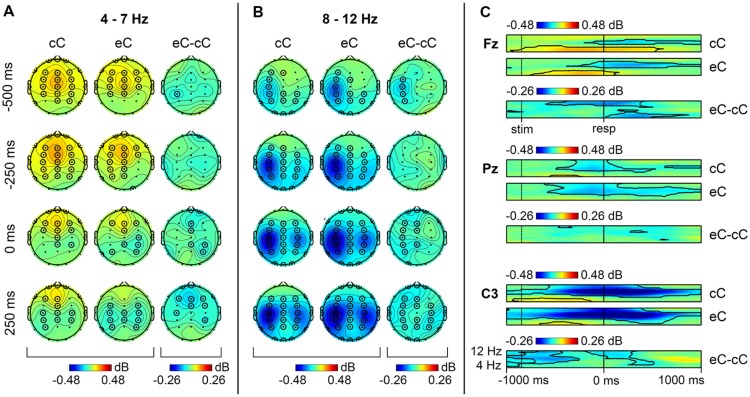
FIGURE 2.
Non-phase locked oscillatory activity in theta and alpha range on cC and eC trials. Topographical maps of theta (A) and alpha (B) band activity at time points relative to the response. Left: spatial distribution of ERSP on cC trials; middle: spatial distribution of ERSP on eC trials; right: spatial distribution of eC–cC log-power difference. (C) Time-frequency plots of theta and alpha band activity at Fz, Pz, and C3 electrodes. Top: dynamics of ERSP on cC trials; middle: dynamics of ERSP on eC trials; bottom: dynamics of eC–cC log-power difference. Other conventions as in Figure 1.

