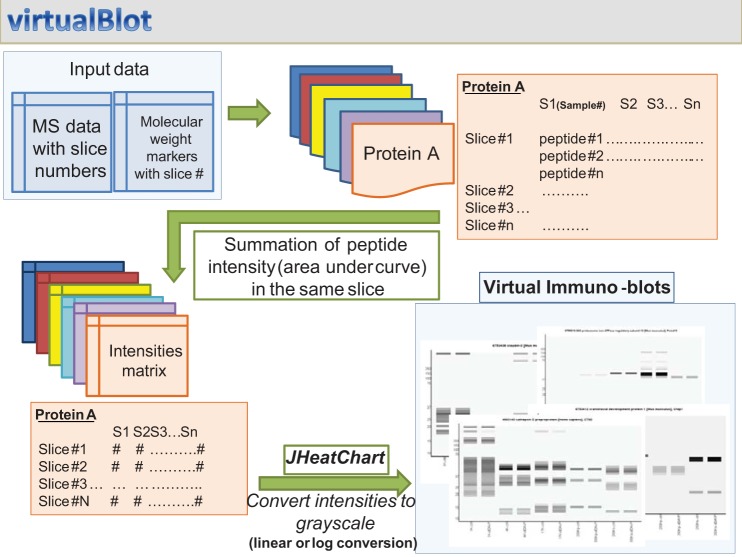
Fig. 2.
A computer program, virtualBlot, was devised for visualization of quantitative mass spectrometry data. A summary of the step-by-step algorithm used to construct jpeg images representing mass spectrometry data in the form of Western blots is shown. Flow is indicated by green arrows. See methods for details.

