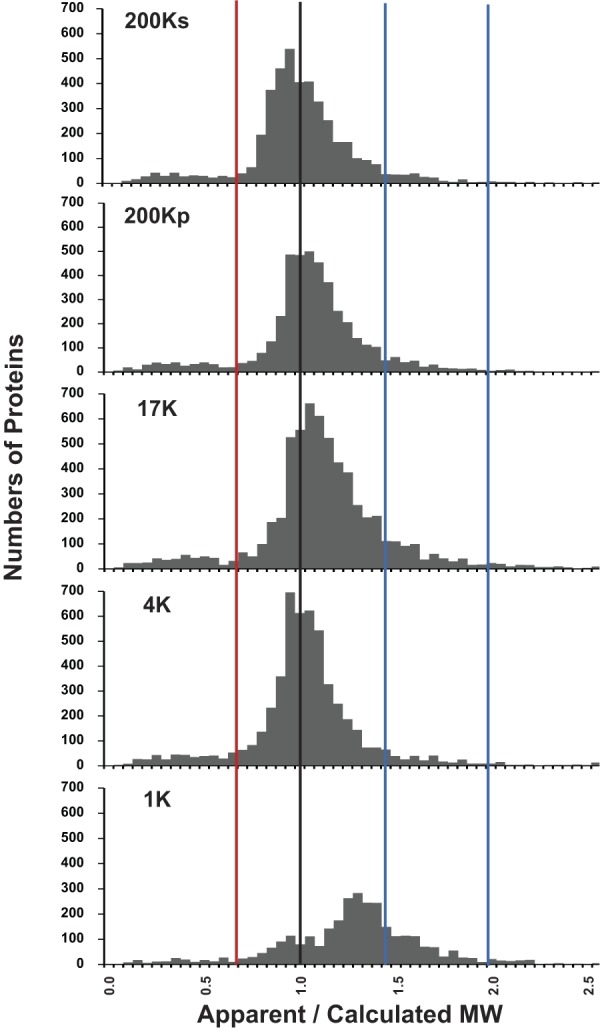
Fig. 6.

Ratios of apparent to calculated molecular weights (ρ) of proteins vary over a wide range, and distribution appears to be trimodal. Histograms for 4 differential-centrifugation fractions (200Ks, 200Kp, 17K, and 4K) show similar patterns, and distributions appear to be trimodal. The 3 modes provide 3 populations for further analysis: 1) proteins below ρ = 0.65 (left of red line), 2) proteins with ρ = 0.65–1.45, and 3) proteins with ρ = 1.45–2.00 (between blue lines). Distribution for the 1K fraction was markedly different from distribution for the other 4 fractions, showing a predominant mode at ρ ∼ 1.3. MW, molecular weight.
