FIGURE 3.
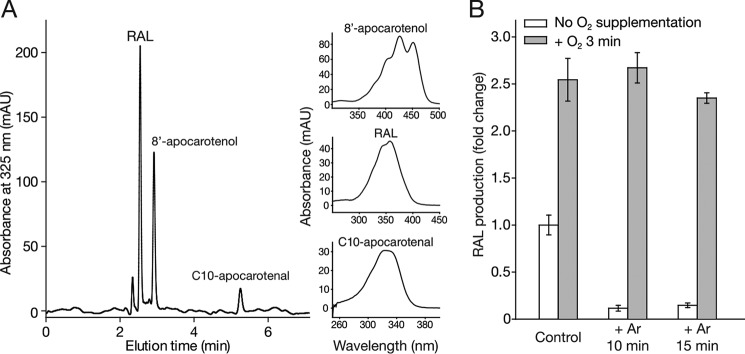
HPLC analysis of ACO-catalyzed reaction products and the influence of O2 depletion and supplementation on ACO enzymatic activity. A, HPLC trace of ACO-catalyzed reaction products generated from cleavage of all-trans-8′-apocarotenol under an 18O2-gas environment. The peak assignments were made based on their elution times and their characteristic absorbance spectra as shown to the right of the HPLC. Absorbance maxima for 8′-apocarotenol, RAL, and C10-carotenal were 425, 360, and 327 nm, respectively. mAU, milliabsorbance units. B, ACO activity assays were performed either without argon pretreatment to displace O2 (control) or after a 10- or 15-min argon purge (white bars) and compared with ACO samples undergoing the same treatments but subjected to 3 min of O2 gas supplementation as a final step (gray bars). Error bars represent S.D.s calculated from measurements performed in triplicate.

