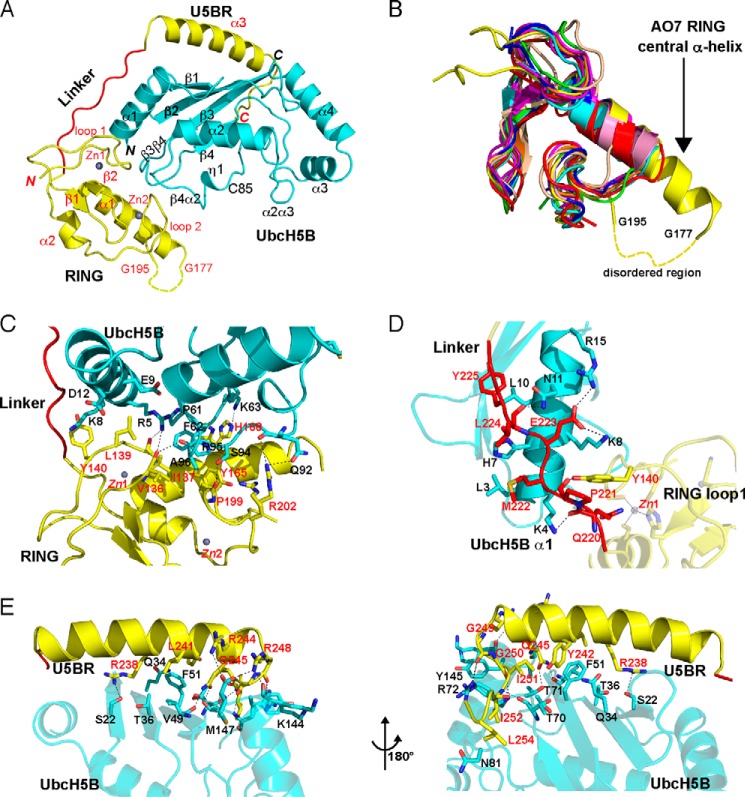
FIGURE 2.
Crystal structure of the AO7RE·UbcH5B complex. A, ribbon diagram of the structure (residue 1 of UbcH5B and residues 126–128, 178–194, and 256–258 of AO7 are not observed and are presumably disordered). UbcH5B is shown in cyan. AO7RE is shown in yellow except for the Linker, in red. Helices, strands, and loops are illustrated as spirals, arrows, and tubes, respectively. The N and C termini and secondary structure elements are labeled in black and red for UbcH5B and AO7, respectively. The disordered peptide (residues 178–194 after the α1 helix) of AO7RE is represented with a dashed curve. Two zinc ions in AO7 RING are illustrated. B, superposition of AO7 RING with other RING and U-box structures (PDB entries 3FL2, 1Z6U, 1FBV, 3HCT, 1LDJ, 2CKL, 2C2V, 3EB6, and 3LRQ). The AO7 RING is shown in yellow, the central α-helix of AO7 RING is labeled, and the disordered peptide in loop 2 of the AO7 RING is indicated with a dashed curve. C–E, the interactions of UbcH5B with AO7 RING (C), Linker (D), and U5BR (E, viewed from two directions). UbcH5B is shown in cyan, RING and U5BR are in yellow, and Linker is in red. The residues involved in electrostatic (cutoff distance = 3.5 Å) and van der Waals (cutoff distance = 4.0 Å) interactions at the interface are shown as sticks. Dashed lines in black indicate salt bridges and hydrogen bonds. The residues involved in the interactions are labeled in black and red for UbcH5B and AO7, respectively.

