FIGURE 8.
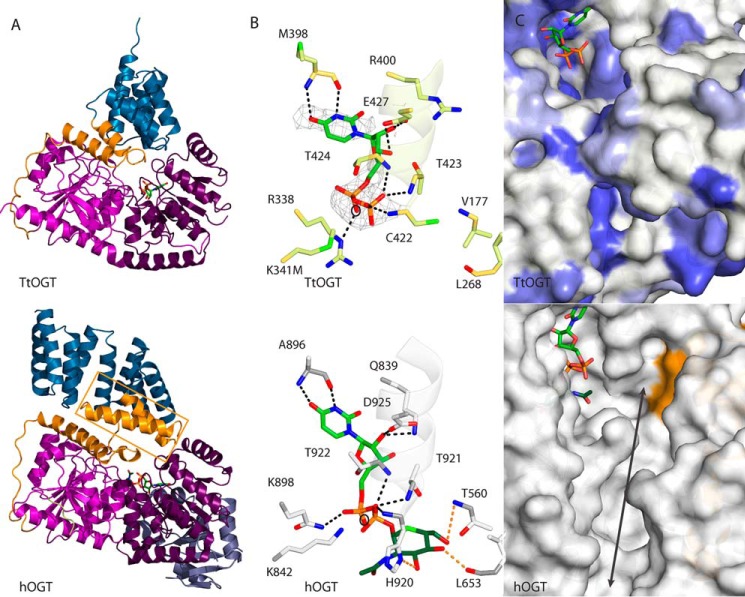
Structural characterization of TtOGT. A, schematic representation of TtOGT depicting the secondary structure elements. Presented in the lower panel is hOGT (Protein Data Bank code 4AY6). The region of the hOGT TLRs that is absent in TtOGT is demarcated with an orange box. Coloring is as in Fig. 1. B, TtOGT active site with the unbiased positive density for UDP. UDP is depicted in stick representation. Interacting residues of TtOGT are labeled, and the interactions are depicted by dashed lines. The α-helical electrostatic dipole is also shown in schematic representation. Presented in the lower panel is a complex of hOGT with UDP-5S-GlcNAc (Protein Data Bank code 4AY6). The orange dashed lines represent the interactions between hOGT and the GlcNAc moiety. The catalytic base is marked by a circle. UDP, light green; GlcNAc, dark green. C, TtOGT active site conservation. Surface residues that are identical in TtOGT and hOGT are colored dark blue, and functionally conserved residues are colored light blue. Presented in the lower panel is the structure of hOGT (Protein Data Bank code 4AY6). The surface region corresponding to the hOGT TLRs that are absent in TtOGT is colored orange. The protein substrate docking groove of hOGT is indicated by an arrow.

