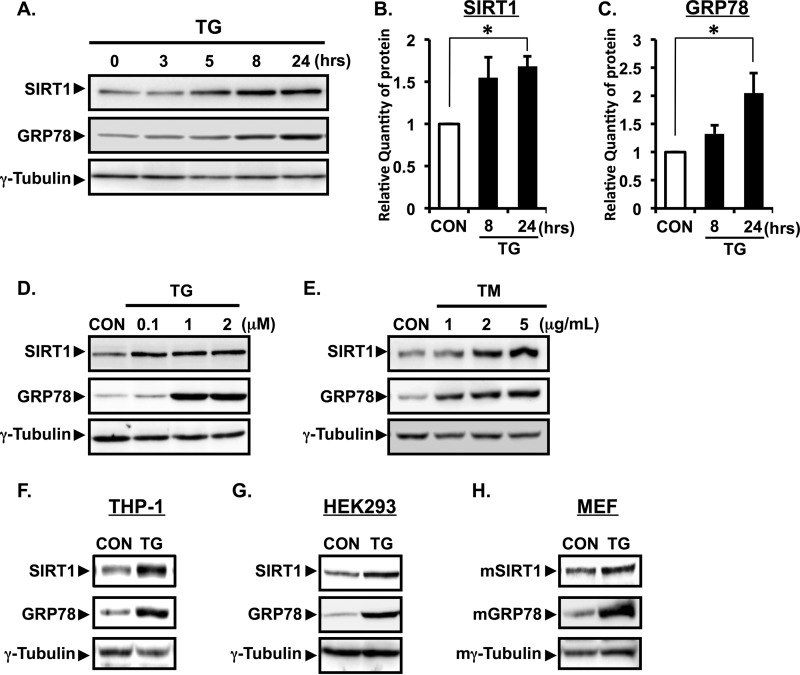
FIGURE 1.
ER stress increases the protein expression of SIRT1 in vitro. A, A549 cells were treated with 1 μm TG for the indicated time. B and C, relative protein quantity of SIRT1 (B) and GRP78 (C) was analyzed by Image Gauge software and normalized with γ-tubulin. Values are the mean ± S.E. (error bars) (n = 3 for B and C). *, p < 0.05 versus control as assessed by one-way analysis of variance with Dunnett procedure. D and E, A549 cells were treated with the indicated concentrations of TG for 24 h (D) or with TM for 12 h (E). THP-1 cells (F) and HEK293 cells (G) were treated for 12 h with TG (1 μm). H, mouse embryonic fibroblast (MEF) cells were treated for 24 h with TG (1 μm). Expression of SIRT1 and GRP78 protein was determined by Western blotting analysis of whole cell lysate. γ-Tubulin was used as a loading control. CON, control.

