
FIGURE 6.
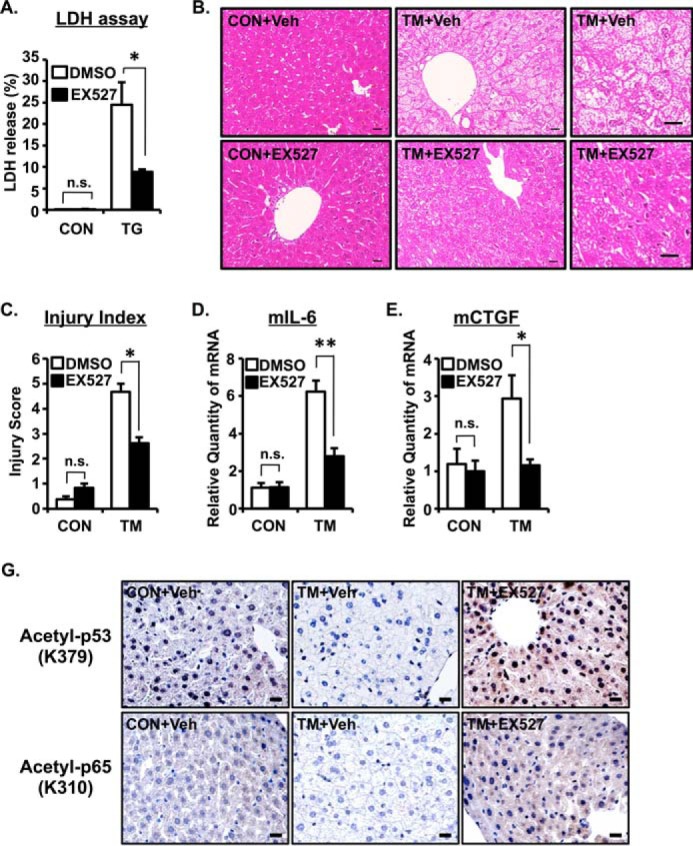
ER stress-induced cell death is positively regulated by SIRT1. A, A549 cells were treated with TG (1 μm) for 24 h with or without EX527, a SIRT1 inhibitor (10 μm). The relative -fold increase of cell mortality was assessed by lactate dehydrogenase (LDH) assay. B–E, mice were injected with TM (1 μg/g) and EX527 (2 μg/g) on Day 0 and Day 1. Livers were collected 72 h after the first injection and subjected to H&E staining (B), hepatic injury quantification (C), and real time quantitative PCR analysis (D and E). 18S rRNA was used as an internal control. Values are the mean ± S.E. (error bars) (n = 3–4 for A, C, and D). Scale bars indicate 20 μm (B). Right panels are high magnification photos of middle panels (B). *, p < 0.05; **, p < 0.01 as assessed by analysis of variance with Dunnett procedure. n.s., not significant. F, TM- and TM + EX527-treated mouse livers were subjected to immunohistochemistry for acetylated p53 (upper panels) and acetylated p65 (bottom panels). Scale bars indicate 20 μm. CON, control; Veh, vehicle.