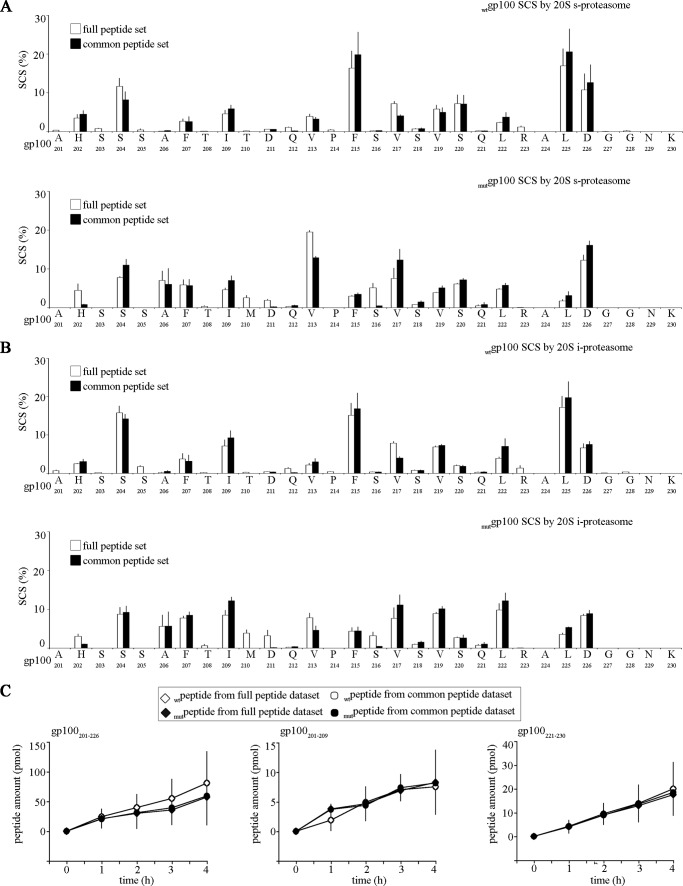
FIGURE 2.
Product peptides specific for wt or mut gp100201–230 substrate degradation only marginally influence the substrate cleavage-site usage by proteasome. The SCSs of the wt or mut gp100201–230 substrate computed by QME considering the full products pool or only the peptides common to both substrates is shown. The analysis is performed for both s- (A) and i- (B) proteasome digestions. Histograms represent the mean of four time points, and bars represent the S.D. of three independent experiments measured in duplicate. C, quantitative kinetics of the representative peptide products gp100201–209, gp100201–226, and gp100221–230 calculated by applying QME to the full or the common peptide pools of the wt and mut gp100201–230 substrate digestion. No major difference in the absolute amount of each peptide was observed between the analysis done with full or the common peptide pools. It proves that the QME method can be applied to this study and does not introduce artifacts due to the difference in the database size. The peptides represent the N- and C-terminal area of the substrates (gp100201–209 and gp100221–230) and two different peptide sizes (gp100201–226 versus gp100201–209 and gp100221–230). We chose these peptides as controls because both the location and the length of the peptide products are relevant in the QME computation of the peptide absolute amount (3). Only the results obtained from s-proteasome-mediated degradation are shown.

