FIGURE 2.
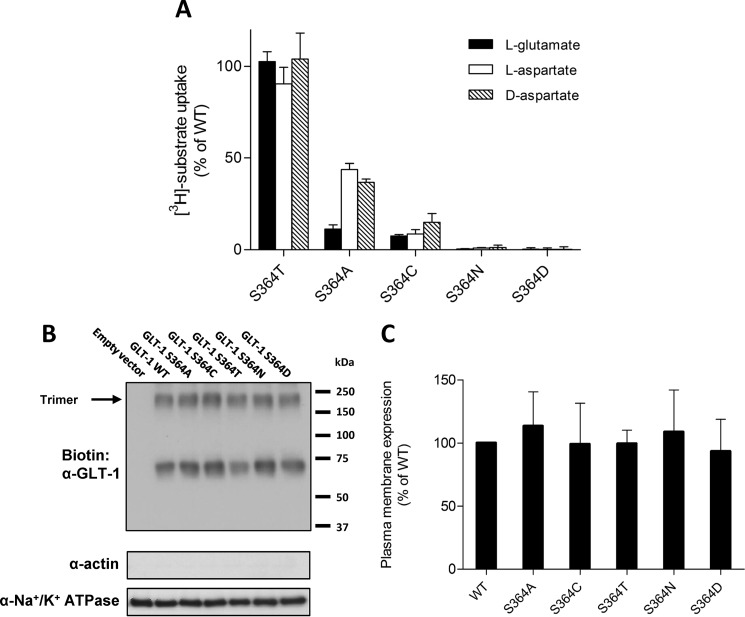
Transport and plasma membrane expression of WT and Ser-364 mutant SLC1A2. A, uptake of 1 mm l-[3H]glutamate (black bars), d-[3H]aspartate (empty bars), and l-[3H]aspartate (hatched bars) by HEK cells expressing the indicated mutants. The uptake of each substrate was corrected for the background uptake by empty vector-transfected HEK cells. Uptake is represented as the percentage of the SLC1A2-WT. The data are means ± S.D. of three independent experiments done in triplicates. Plasma membrane expression of SLC1A2-WT and the indicated mutants was assessed by immunoblotting of the labeled plasma membrane protein by sulfo-NHS-LC-biotin isolated on streptavidin-agarose beads. B, a representative experiment is shown. The absence of actin signal confirms the purity of the membrane fraction, Na+/K+ ATPase was used as equal loading control. C, quantification of plasma membrane expression from three independent experiments. For each substrate, data were normalized to the uptake of SLC1A2-WT transfected HEK cells in each individual experiment and are represented as the percentage of SLC1A2-WT.

