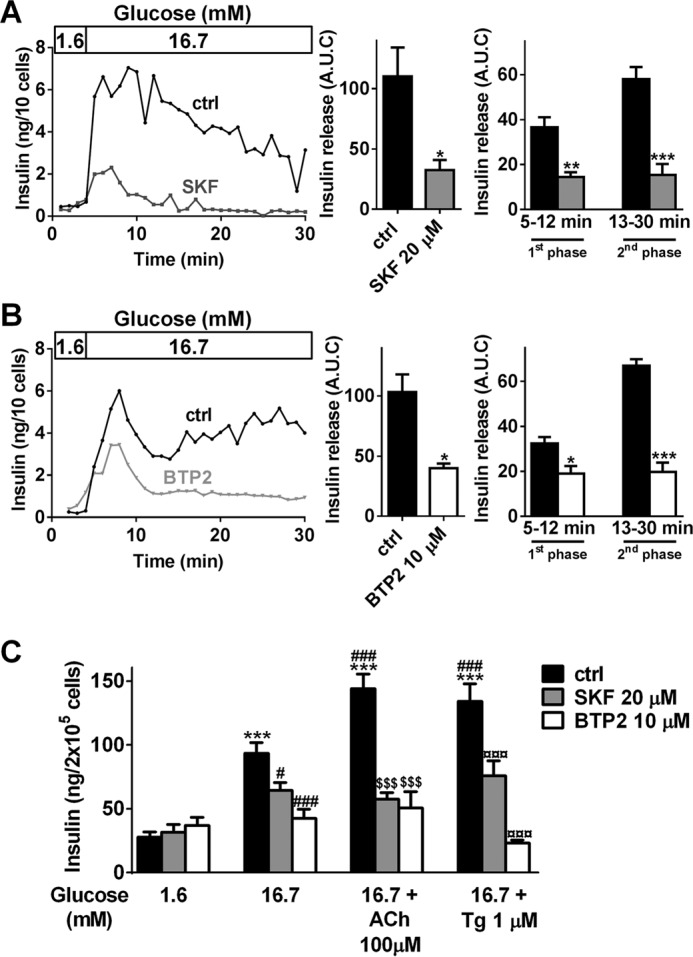
FIGURE 1.

Inhibition of SOCs by SKF-96365 or BTP2 leads to impaired GSIS in β-cells. A and B, perifusion experiments of primary rat islets preincubated at 1.6 mm glucose and exposed to 16.7 mm glucose, in the absence (control, ctrl) or presence of 20 μm SKF-96365 (SKF, A) or 10 μm BTP2 (B). Left panels, representative traces of insulin release in the absence (ctrl, black traces) or presence of SKF (A, dark gray trace) or BTP2 (B, light gray trace). Middle panels, data are areas under the curve (A.U.C.) of insulin release from three to five independent experiments. *, p < 0.05 versus respective control insulin secretion. Right panels, quantification of insulin release during the first phase (5–12 min) or second phase (13–30 min). The data are the areas under the curve from three to five independent experiments. *, p < 0.05; **, p < 0.01; ***, p < 0.001 versus respective ctrl insulin secretion. C, INS-1E cells were cultivated for 30 min in KRBH supplemented with 1.6, 16.7, or 16.7 mm glucose + 100 μm ACh or 16.7 mm glucose + 1 μm Tg in the absence (ctrl, black bars) or presence of SKF (20 μm, gray bars) or BTP2 (10 μm, white bars). Supernatants were collected after 30 min of stimulation. The data are from five independent experiments. ***, p < 0.001 versus basal insulin secretion at 1.6 mm glucose; #, p < 0.05; ###, p < 0.001 versus insulin secretion at 16.7 mm glucose; $$$, p < 0.001 versus insulin secretion at 16.7 mm glucose + ACh; ¤¤¤, p < 0.001 versus insulin secretion at 16.7 mm glucose + Tg.
