FIGURE 2.
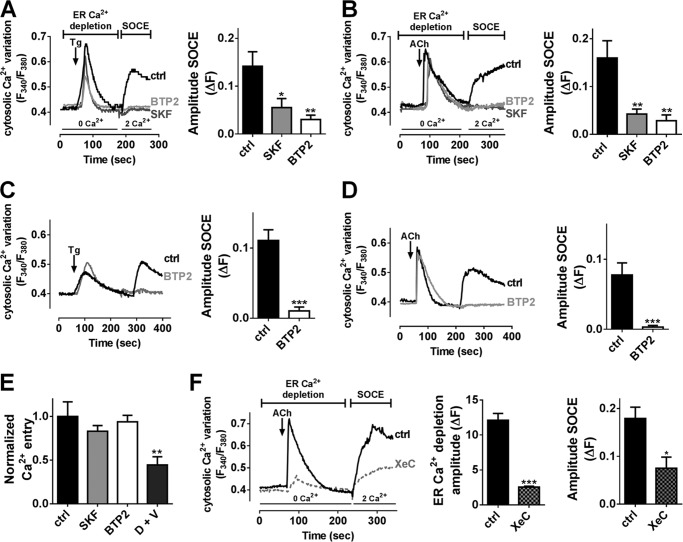
Inhibition of SOCs by SKF-96365 or BTP2 leads to reduced Tg- and ACh-induced SOCE in INS-1E cells and primary rat islet cells. Typical recording of [Ca2+]i variations measured with Fura-2/AM in INS-1E (A and B) and in dispersed rat islets cells (C and D) at 20 mm glucose. ER Ca2+ content was depleted in Ca2+-free medium by application of 2 μm Tg (A and C) or 100 μm ACh (B and D) in the presence of D+V. SOCE was measured by the addition of 2 mm Ca2+ in the extracellular medium also in the presence of D+V. A and B, left panels, representative mean traces of [Ca2+]i variation in INS-1E cells exposed to Tg (A) or ACh (B) in the absence (ctrl, black traces) or presence of 20 μm SKF (dark gray traces) or 10 μm BTP2 (light gray traces). Right panels, quantification of the amplitude of SOCE (ΔF) upon extracellular addition of 2 mm Ca2+. n = 5–7 experiments, n = 30 investigated cells/experiment minimum. *, p < 0.05; **, p < 0.01 versus ctrl condition. C and D, left panels, representative mean traces of [Ca2+]i variation in dispersed rat islets cells exposed to Tg (C) or ACh (D) in the absence (ctrl, black traces) or presence of 10 μm BTP2 (light gray traces). Right panels, quantification of the amplitude of SOCE (ΔF) upon extracellular addition of 2 mm Ca2+. n = 4 experiments, n = 10 investigated cells/experiment minimum. ***, p < 0.001 versus ctrl condition. E, quantification of high glucose-induced Ca2+ influx in nondepleted cells in absence (ctrl) or presence of the indicated inhibitors. **, p < 0.01 versus ctrl condition. n = 5 experiments, n = 30 investigated cells/experiment minimum. F, left panel, representative mean traces of [Ca2+]i variation in INS-1E cells exposed to ACh in the presence or not (ctrl) of xestospongin C (XeC). Middle panel, quantification of ACh-induced ER Ca2+ depletion content. Right panel, quantification of the amplitude of SOCE (ΔF) upon extracellular addition of 2 mm Ca2+. n = 4 experiments, n = 20 investigated cells/experiment minimum. *, p < 0.05; ***, p < 0.001 versus ctrl condition.

