
FIGURE 4.
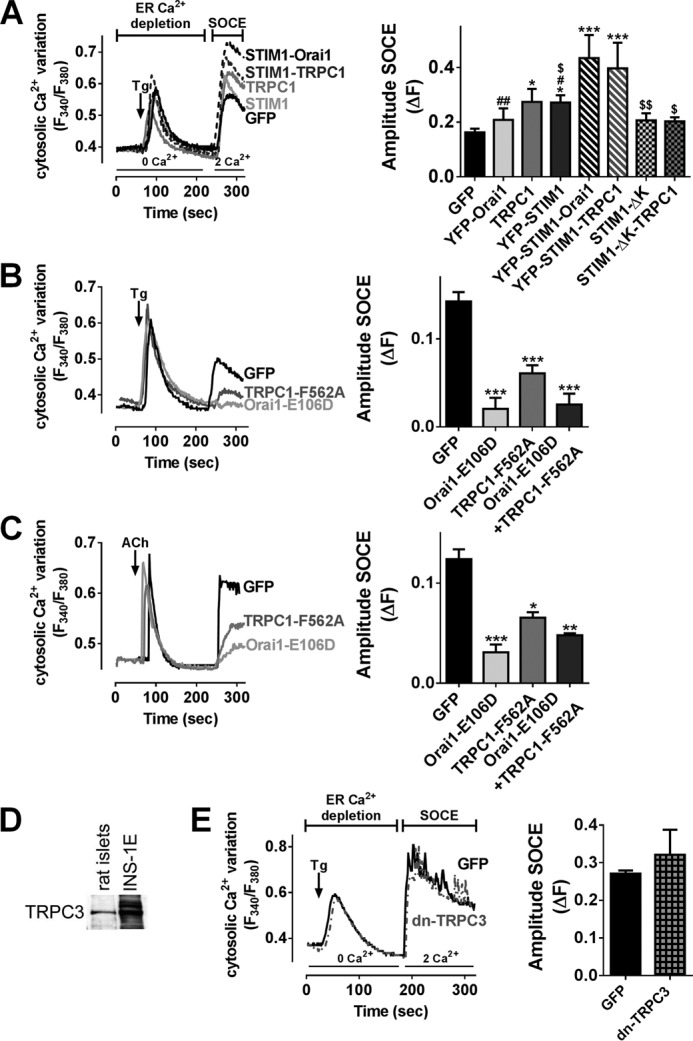
Orai1 and TRPC1 mediate Tg- and ACh-dependent Ca2+ entry in INS-1E cells. A, Fura-2/AM imaging in INS-1E cells transfected with the indicated plasmids in KRBH supplemented with 20 mm glucose. B and C, Fura-2/AM imaging in INS-1E cells transfected with the indicated plasmids in KRBH supplemented with 20 mm glucose in the presence of D+V. A, left panel, representative mean traces of [Ca2+]i variation in INS-1E cells exposed to Tg 2 μm in GFP-transfected cells (black trace), in transfected cells with YFP-STIM1 (light gray trace) or with TRPC1 (dark gray trace), in co-transfected cells with YFP-STIM1 and TRPC1 (dotted gray trace), or in co-transfected cells with YFP-STIM1 and YFP-Orai1 (dotted black trace). Right panel, quantification of the amplitude of SOCE (ΔF) upon extracellular addition of 2 mm Ca2+. n = 5–13 experiments, n = 10 investigated cells/experiment minimum. *, p < 0.05; ***, p < 0.001 versus GFP-transfected cells; #, p < 0.05; ##, p < 0.01 versus STIM1-Orai1-transfected cells; $, p < 0.05; $$, p < 0.01 versus STIM1-TRPC1-transfected cells. B and C, left panels, representative mean traces of [Ca2+]i variation in INS-1E cells exposed to Tg (B) or ACh (C) in GFP-transfected cells (black traces), in transfected cells with TRPC1-F562A (dark gray traces), or in transfected cells with Orai1-E106D (light gray traces). Right panels, quantification of the amplitude of SOCE (ΔF) upon extracellular addition of 2 mm Ca2+. n = 4 experiments, n = 10 investigated cells/experiment minimum. *, p < 0.05; **, p < 0.01; ***, p < 0.001 versus GFP-transfected cells. D, representative Western blot experiments of TRPC3 protein expression in rat islets and INS-1E cells (n = 3 experiments). E, Fura-2/AM imaging in INS-1E cells transfected with pmaxGFP (GFP) or dominant negative TRPC3 plasmid in KRBH supplemented with 20 mm glucose. Left panel, representative mean traces of [Ca2+]i variation in INS-1E cells exposed to Tg 2 μm in GFP-transfected cells (black trace) and in transfected cells with dominant negative TRPC3 (dotted gray trace). Right panel, quantification of the amplitude of SOCE (ΔF) upon extracellular addition of 2 mm Ca2+. n = 4 experiments, n = 25 investigated cells/experiment minimum.