FIGURE 6.

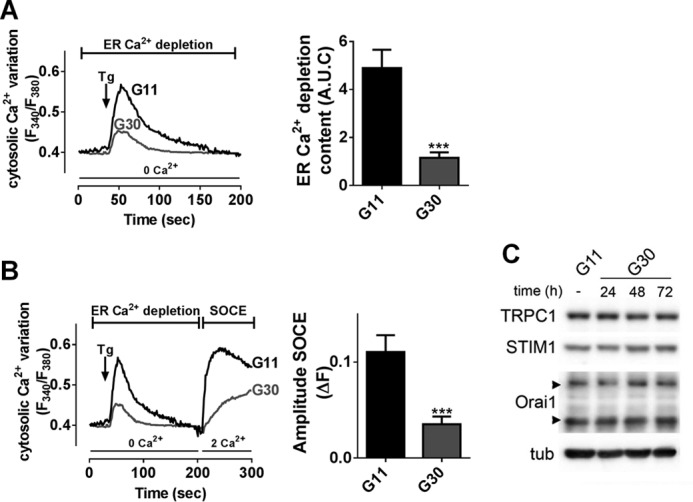
Prolonged high glucose concentration impairs Tg-induced Ca2+ influx. A and B, Fura-2/AM imaging in INS-1E cells maintained in 11 mm glucose (G11) or 30 mm glucose (G30) for 72 h in the presence of D+V. A, left panel, representative mean traces of ER Ca2+ depletion induced by 2 μm Tg in Ca2+-free medium. Right panel, quantification of Tg-induced ER Ca2+ release content (A.U.C.). B, left panel, representative mean traces of [Ca2+]i variation. Right panel, quantification of the amplitude of SOCE (ΔF) upon extracellular addition of 2 mm Ca2+. n = 4–7 experiments, n = 20 investigated cells/experiment minimum. ***, p < 0.001 versus G11 condition. C, representative Western blot of TRPC1, STIM1, Orai1, and α-tubulin (tub) in INS-1E cells cultivated in G11 or G30 condition for 24, 48, or 72 h. n = 4 experiments.
