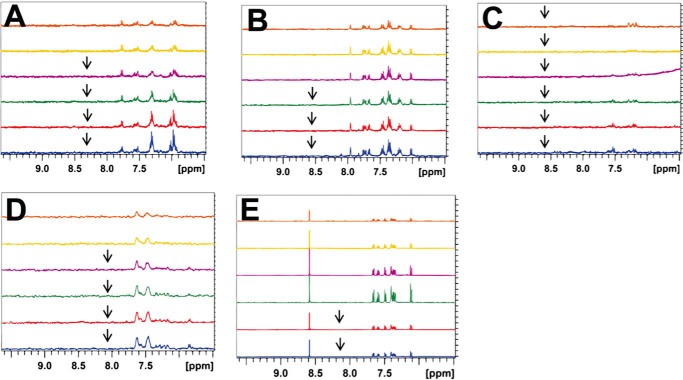
FIGURE 7.
Solubility test of compounds in phosphate buffer. A–E, 1H NMR spectra of compounds with different desired concentration in 50 mm potassium phosphate, pH 6.5. Orange, 12.5 μm; yellow, 25 μm; purple, 50 μm; green, 100 μm; red, 150 μm; blue, 200 μm. A stock solution of 10 mm compound was prepared in DMSO-d6. The arrows are placed to indicate that precipitations of compound were observed during the NMR experiment at the concentration. A, 3235-0367. B, 1094-0205. C, 2124-0331. D, NSC36784. E, NSC654259.

