
FIGURE 4.
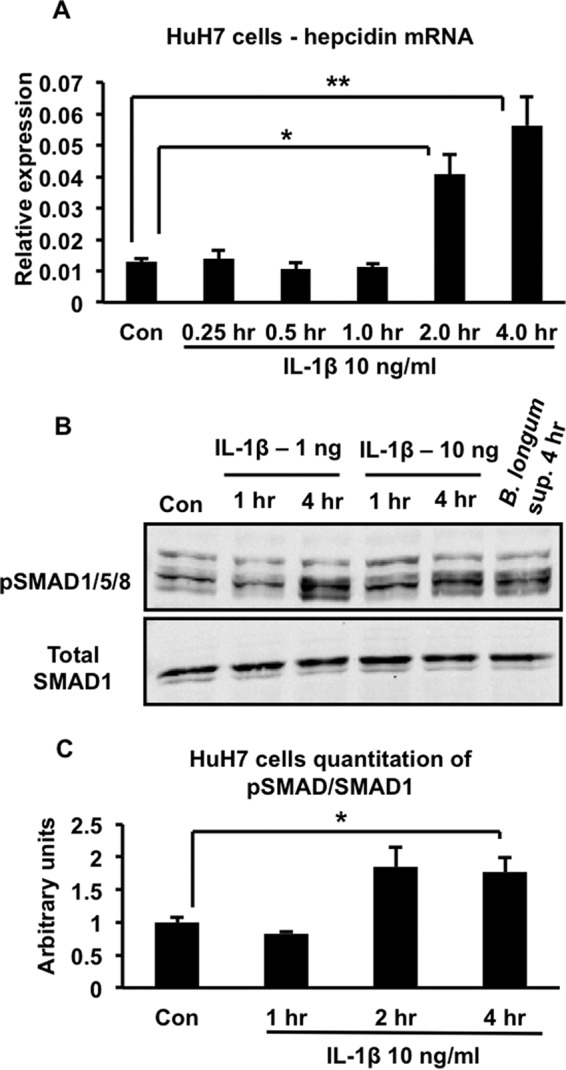
Effects of IL-1β on hepcidin expression and BMP signaling in HuH7 cells. A, HuH7 cells were treated with 10 ng/ml of IL-1β for the indicated times, and hepcidin expression was analyzed by quantitative RT-PCR. *, p = 0.04; **, p = 0.03; n = 3 samples/group from one of two similar experiments. Con, control. B, HuH7 cells were treated with 1 or 10 ng/ml of IL-1β for different times from 1–4 h or with the supernatant of B. longum-infected THP-1 cells for 4 h. Cell lysates were analyzed by SDS-PAGE and immunoblotting with antibodies to either phosphorylated SMAD1/5/8 (pSMAD1/5/8) or total SMAD1. C, quantitation of Western blots corresponding to B. The intensities of the phosphorylated SMAD1/5/8 and total SMAD1 bands in blots from multiple experiments were determined by Li-Cor imaging, and the ratio was calculated. *, p = 0.01; n = 3–5 samples/group from multiple experiments.