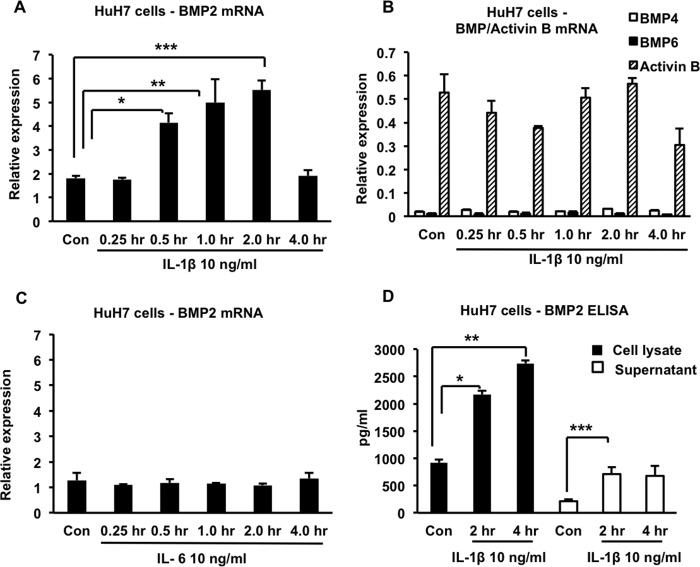
FIGURE 5.
Effects of IL-1β and IL-6 on BMP expression in HuH7 cells. A, HuH7 cells were treated with 10 ng/ml of IL-1β for the indicated times, and BMP2 expression was analyzed by quantitative RT-PCR. *, p = 0.02; **, p = 0.03; ***, p = 0.008. Con, control. B, the same RNA samples as in A were analyzed by quantitative RT-PCR for expression of BMP4, BMP6, and activin B. C, HuH7 cells were treated with 10 ng/ml of IL-6 for the indicated times, and BMP2 expression was analyzed by quantitative RT-PCR. D, HuH7 cells were treated with 10 ng/ml of IL-1β for the indicated times, and BMP2 concentrations in the cell lysates and cell supernatants were determined by ELISA. *, p = 0.002; **, p = 0.004; ***, p = 0.04. In all cases, n = 3 samples/group from one of two similar experiments.

