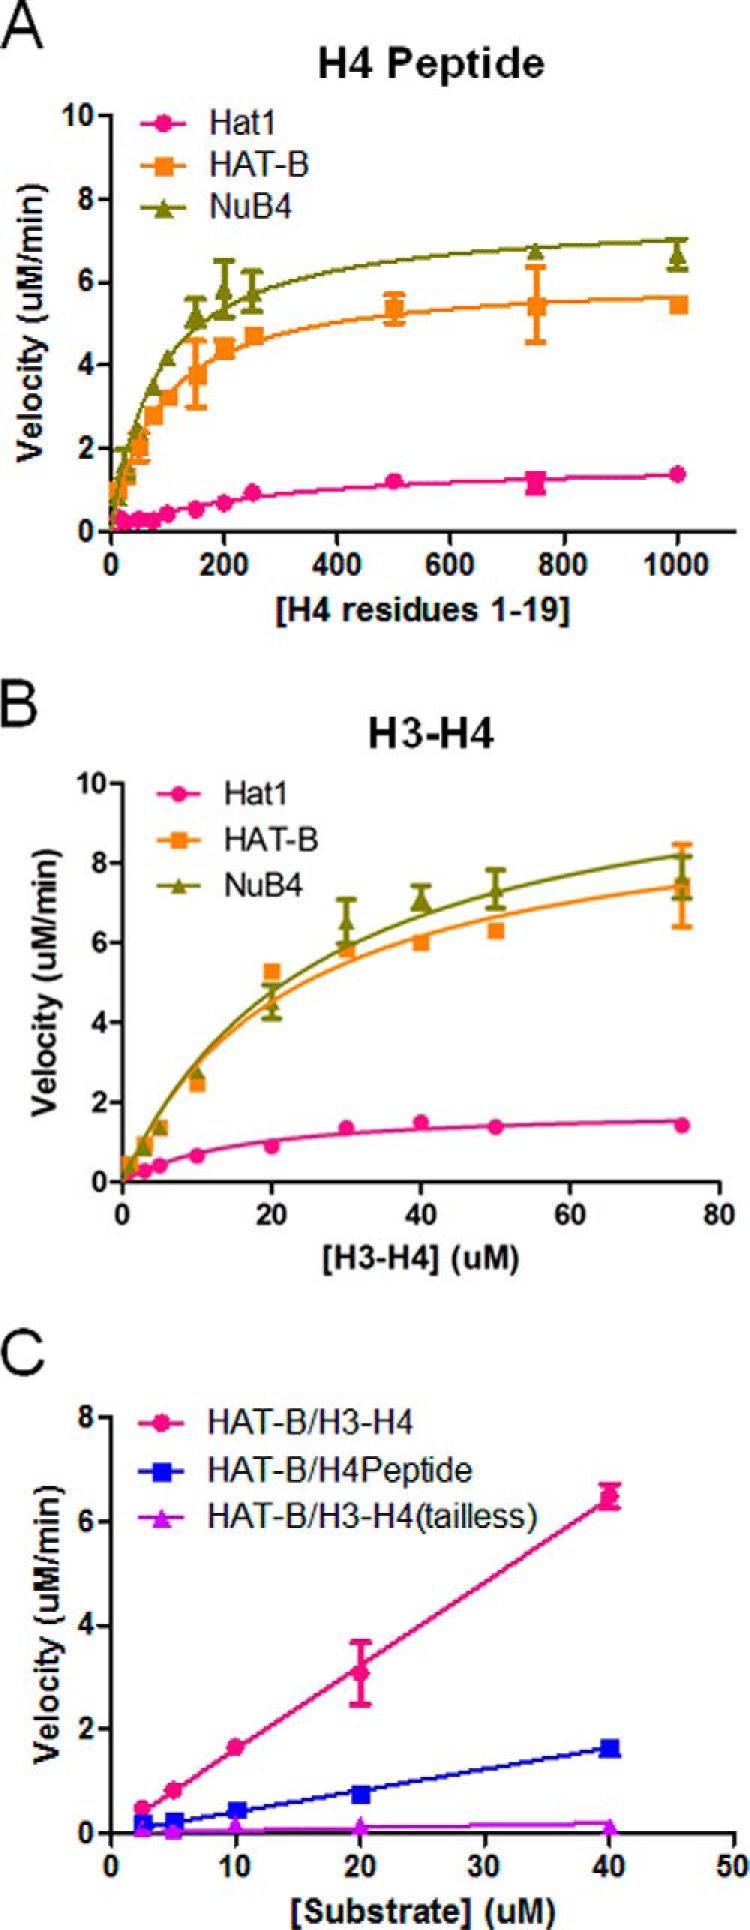
FIGURE 4.

Activity of Hat1 and Hat1-containing complexes against histone H4 substrates. A and B, the data for Hat1 (red) or Hat1-containing complexes (yellow and green) at varying concentrations of H4 peptide (residues 1–19, 2.5–1000 μm) (A) or H3-H4 histones (1–75 μm) (B) are fit to Michaelis-Menten kinetics (GraphPad Prism 5) to calculate steady state parameters. C, the data for HAT-B at varying concentrations of H4 peptide (blue), H3-H4 (pink), or tail-less H3-H4 (H3(45–135)-H4(20–120)) (purple) residues H3-H4 histones (1–75 μm) are fit to the linear portion of the rate data (GraphPad Prism 5) to calculate kcat/Km. All reactions were performed using 100 nm enzyme at saturating concentrations of 14C-labeled acetyl CoA (500 μm), and all kinetic measurements were carried out in duplicate.
