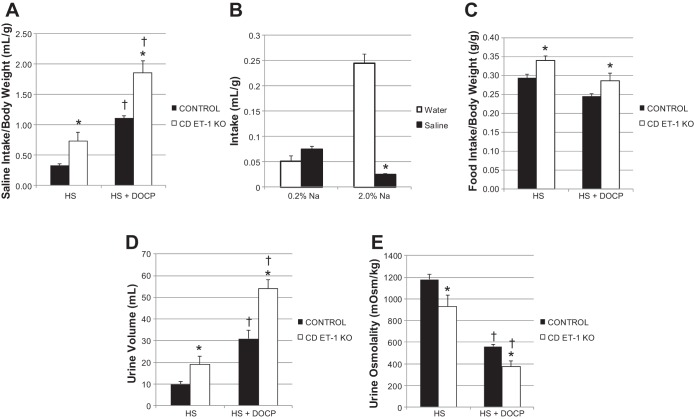
Fig. 1.
Saline and food intake, urine volume, and osmolality. Saline intake (A), preference (water vs. saline; B), and food intake (C) are shown as means ± SE normalized for body weight. Urinary output (D) and osmolality (E) are shown as means ± SE. Control, n = 9–10; collecting duct (CD)-specific endothelin-1 (ET-1) knockout (CD ET-1 KO) mice, n = 6. HS, average of days 6–8 of high-salt treatment; HS + DOCP, average of days 17–19 of DOCP (desoxycorticosterone pivalate) treatment. In A, C–E, *P < 0.05 vs. control within same treatment, unpaired Student's t-test; †P < 0.05 vs. HS treatment within same genotype, paired Student's t-test. In B, *P < 0.05 vs. water, same treatment, unpaired Student's t-test.

