
Fig. 4.
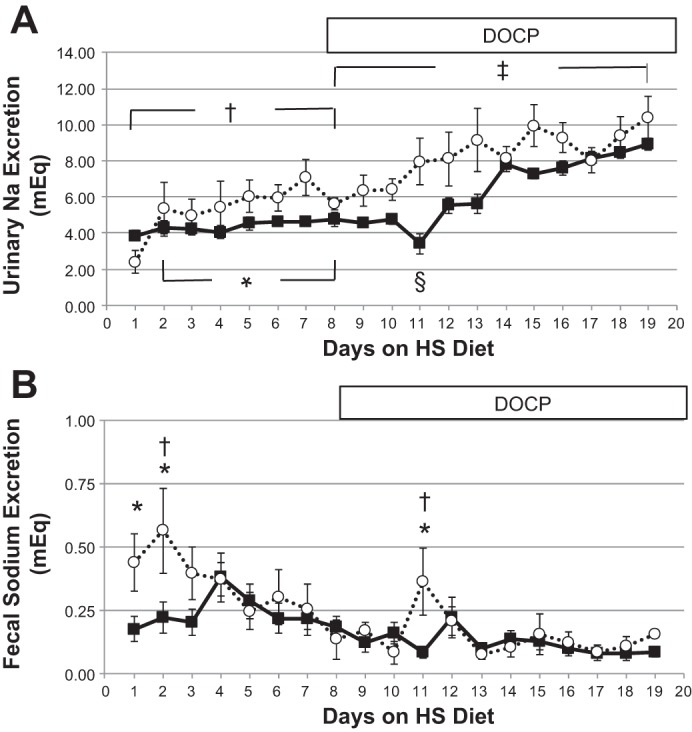
Sodium excretion. Urinary Na excretion (A) and fecal Na excretion (B) are shown as means ± SE. Solid lines are controls, and dashed lines are CD ET-1 KO. Control, n = 9–10; CD ET-1 KO, n = 6. In A, *P < 0.05, significant effect of genotype, repeated-measures ANOVA; †P < 0.05, significant effect of treatment within CD ET-1 KO, repeated-measures ANOVA; ‡P < 0.05, significant effect of genotype and treatment, repeated-measures ANOVA; §P < 0.05, significant effect of treatment within control, repeated-measures ANOVA, post hoc day 11 vs. days 8 and 12–19. In B, *P < 0.05, significant effect of genotype, repeated-measures ANOVA post hoc, days 1, 2, and 11; †P < 0.05, significant effect of treatment within CD ET-1 KO, repeated-measures ANOVA, post hoc, day 2 vs. days 8, 10, and 13–19 and day 11 vs. days 10, 13, 14, and 17.