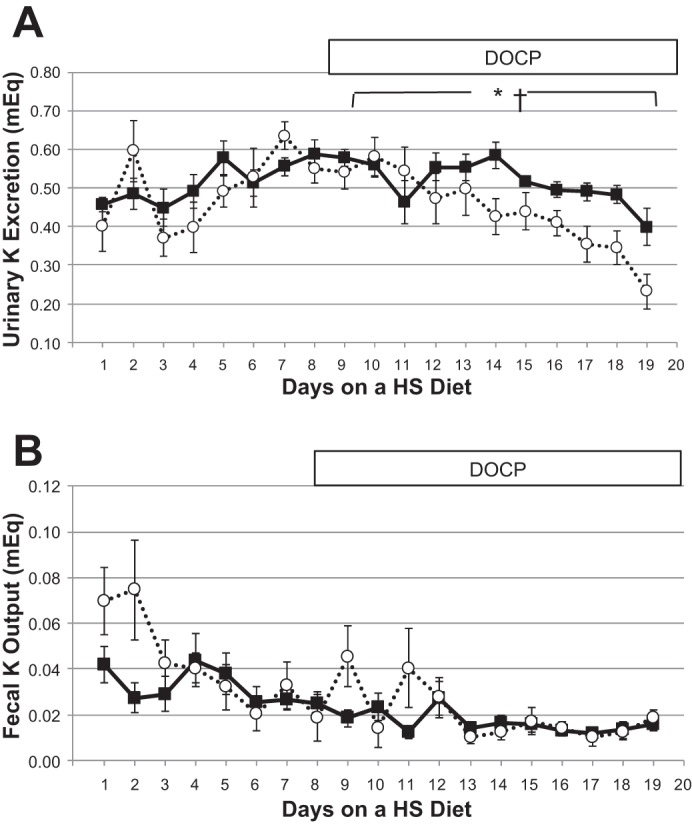
Fig. 7.

Urinary and fecal K excretion. A and B: urinary and fecal K excretion, respectively. Solid lines are controls, and dashed lines are CD ET-1 KO. Control, n = 9; CD ET-1 KO, n = 6. *P < 0.05, significant effect of genotype, repeated-measures ANOVA; †P < 0.05 significant effect of treatment in both genotypes, repeated-measures ANOVA.
