Fig. 3.
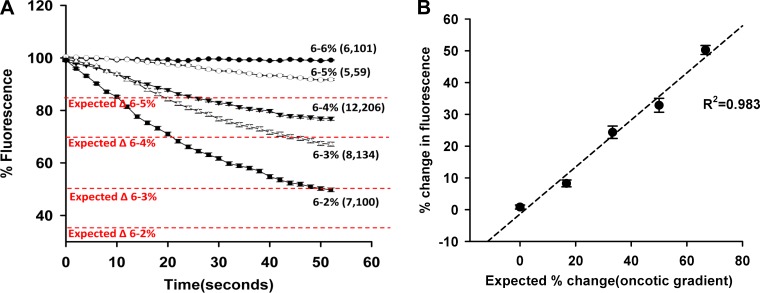
Response to different oncotic gradients. A: fluorescence dilution curves. Changes in the fluorescent intensity in FITC-dextran-labeled glomeruli isolated from SD rats exposed to different oncotic gradients are presented. The expected fall in fluorescence based on the change in oncotic pressure is presented in red. B: relationship between the measured change in fluorescence vs. the % fall in oncotic pressure. The % change in fluorescence intensity in the isolated glomeruli is linearly related to the % change in oncotic pressure. Values are means ± SE. Numbers in parentheses indicate the number of rats and glomeruli studied per group.

