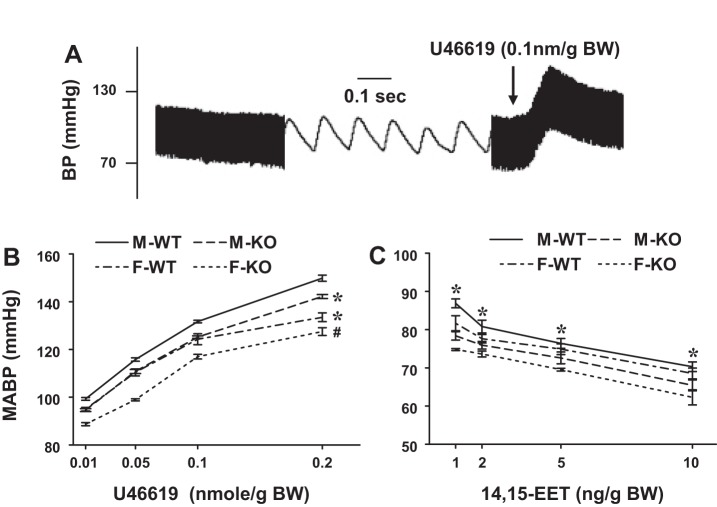
Fig. 3.
A: original tracing for changes in arterial blood pressure in response to U46619. B: dose-dependent increases in MABP in response to U46619 in male and female WT and sEH-KO mice (n = 6–9 in each group). *Curve of M-KO or F-WT mice shows significant reduction compared with that of M-WT mice. #Curve of F-KO mice shows significant reduction compared with those of other 3 groups of mice. C: 14,15-EET-induced reduction in MABP in the 4 groups of mice (n = 5 in each group). *Significant reduction at each dose of 14,15-EET in 4 groups of mice compared with their basal line.

