Fig. 10.
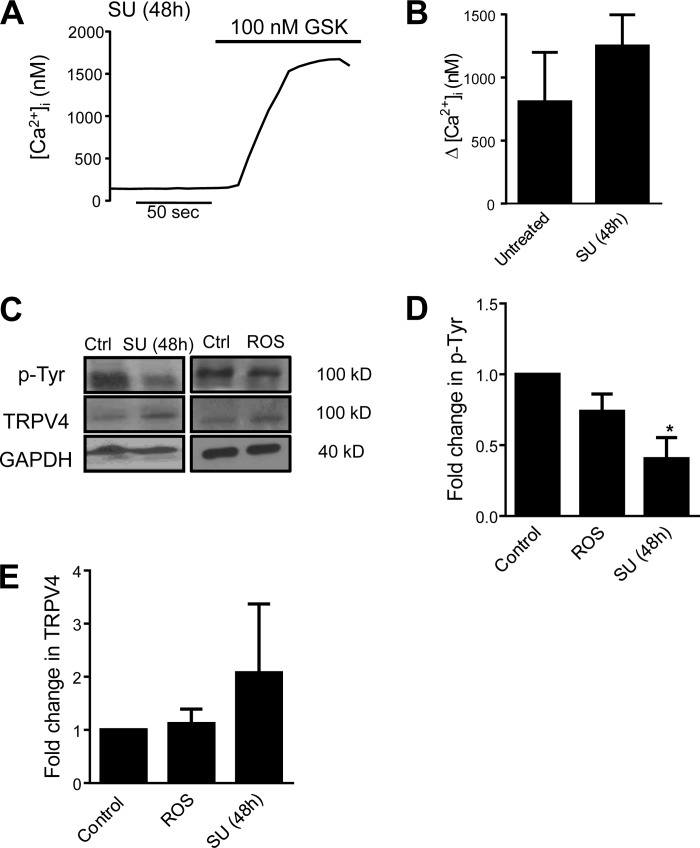
A: representative trace of [Ca2+]i in HLMVEC exposed to GSK (100 nM) after treatment with SU (5 μM) for 48 h. B: bar graph showing mean ± SE change in [Ca2+]i in control and SU-treated HLMVEC following exposure to GSK (n = 5 experiments/group). C–E: representative immunoblot images and densitometry showing protein levels of phosphotyrosine and TRPV4 protein in HLMVEC under control conditions, or treated with either 250 μM H2O2 or SU (5 μM). *Significant difference from control; n = 3 independent experiments.

