Fig. 2.
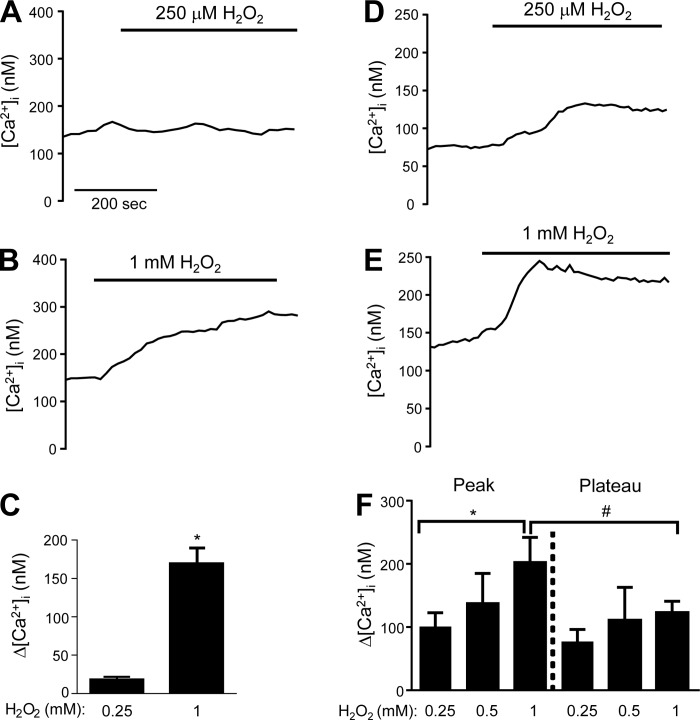
Representative traces (A and B) and bar graph (C) showing mean ± SE change in intracellular Ca2+ ([Ca2+]i) from baseline in mouse lung microvascular endothelial cells (MLMVEC) exposed to 250 μM and 1 mM H2O2 in Krebs buffer (n = 4–6 experiments, 25–30 cells/experiment). Representative traces (D and E) and bar graph (F) showing means ± SE in human lung microvascular endothelial cells (HLMVEC) exposed to increasing doses of H2O2 (n = 6–12 experiments, 20–40 cells/experiment for all groups). *Significant difference from 250 μM; #significant difference between peak and plateau Δ[Ca2+]i.

