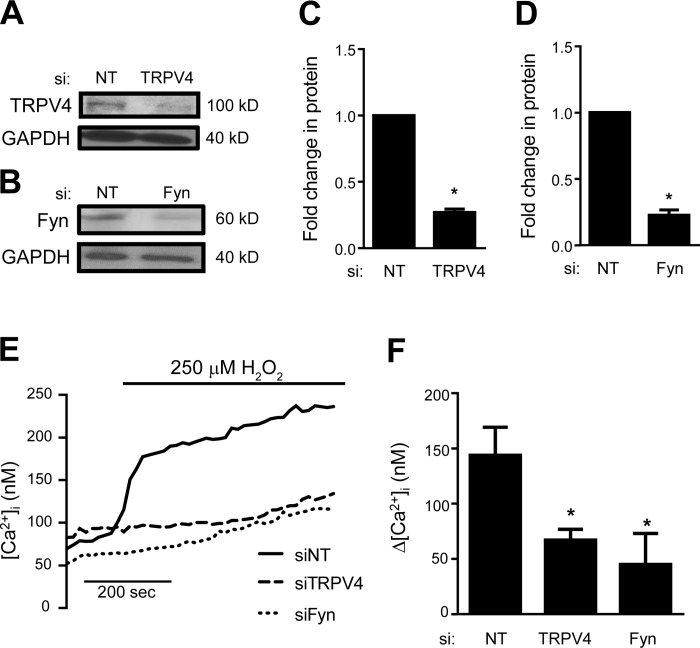
Fig. 9.
Representative immunoblot images (A and B) and densitometry (C and D) showing TRPV4 and Fyn protein levels for HLMVEC transfected with nontargeting (siNT) and TRPV4 (siTRPV4) or Fyn (siFyn) siRNA (n = 3 independent experiments). Representative traces (E) and bar graph (F) showing mean ± SE change in [Ca2+]i in HLMVEC transfected with siNT, siTRPV4, or siFyn and exposed to 250 μM H2O2 (n = 4–7 experiments/group, 20–40 cells/experiment). *Significant difference from siNT.

