Figure 5.
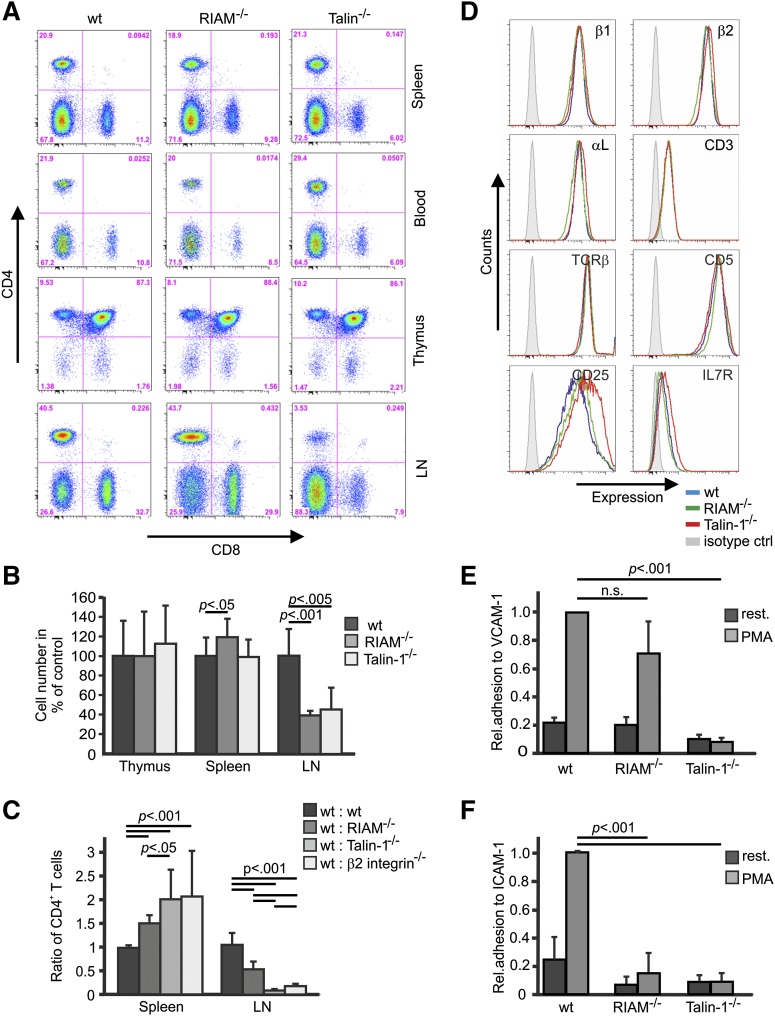
RIAM−/− T cells display defective β2 and β1 integrin functions. (A) Distribution of CD4 and CD8 T cells in different tissues derived from wt, RIAM−/−, and talin-1fl/flCD4Cre+ mice. Life cells were gated and analyzed for CD4 and CD8 expression. (B) Cellularity of thymus, spleen, and LNs of the indicated genotypes, shown relative to wt (n ≥ 4 mice). (C) Cell Trace carboxyfluorescein diacetate succinimidyl ester (CFSE) and Far Red–stained splenocytes from wt or RIAM−/−, talin-1−/−, and β2 integrin−/−−/− mice were IV injected into wt recipients at a 1:1 ratio and the ratio of mutant to wt CD4-positive cells in spleen and LN was determined by FACS (n = 12, 9, 9, 6 mice). (D) Representative FACS blots showing surface levels of β1 integrin, β2 integrin, αL integrin, CD3, TCRβ, CD5, CD25, and IL7R on ConA-activated and CD4-positive wt (blue), RIAM−/− (green), and talin-1−/− (red) T cells. Isotype staining is shown in light gray. (E-F) Static adhesion of untreated and PMA-treated, ConA-stimulated, and CD4-positive wt, RIAM−/−, and talin-1−/− T cells on ICAM-1 and VCAM-1, respectively, relative to wt PMA-treated T cells (n = 3 independent experiments). Adherent cells were stained with crystal violet and the staining intensity was measured at OD of 595 nm. Data are shown as mean ± SD. P values indicate significant differences and were calculated with the Student t test.

